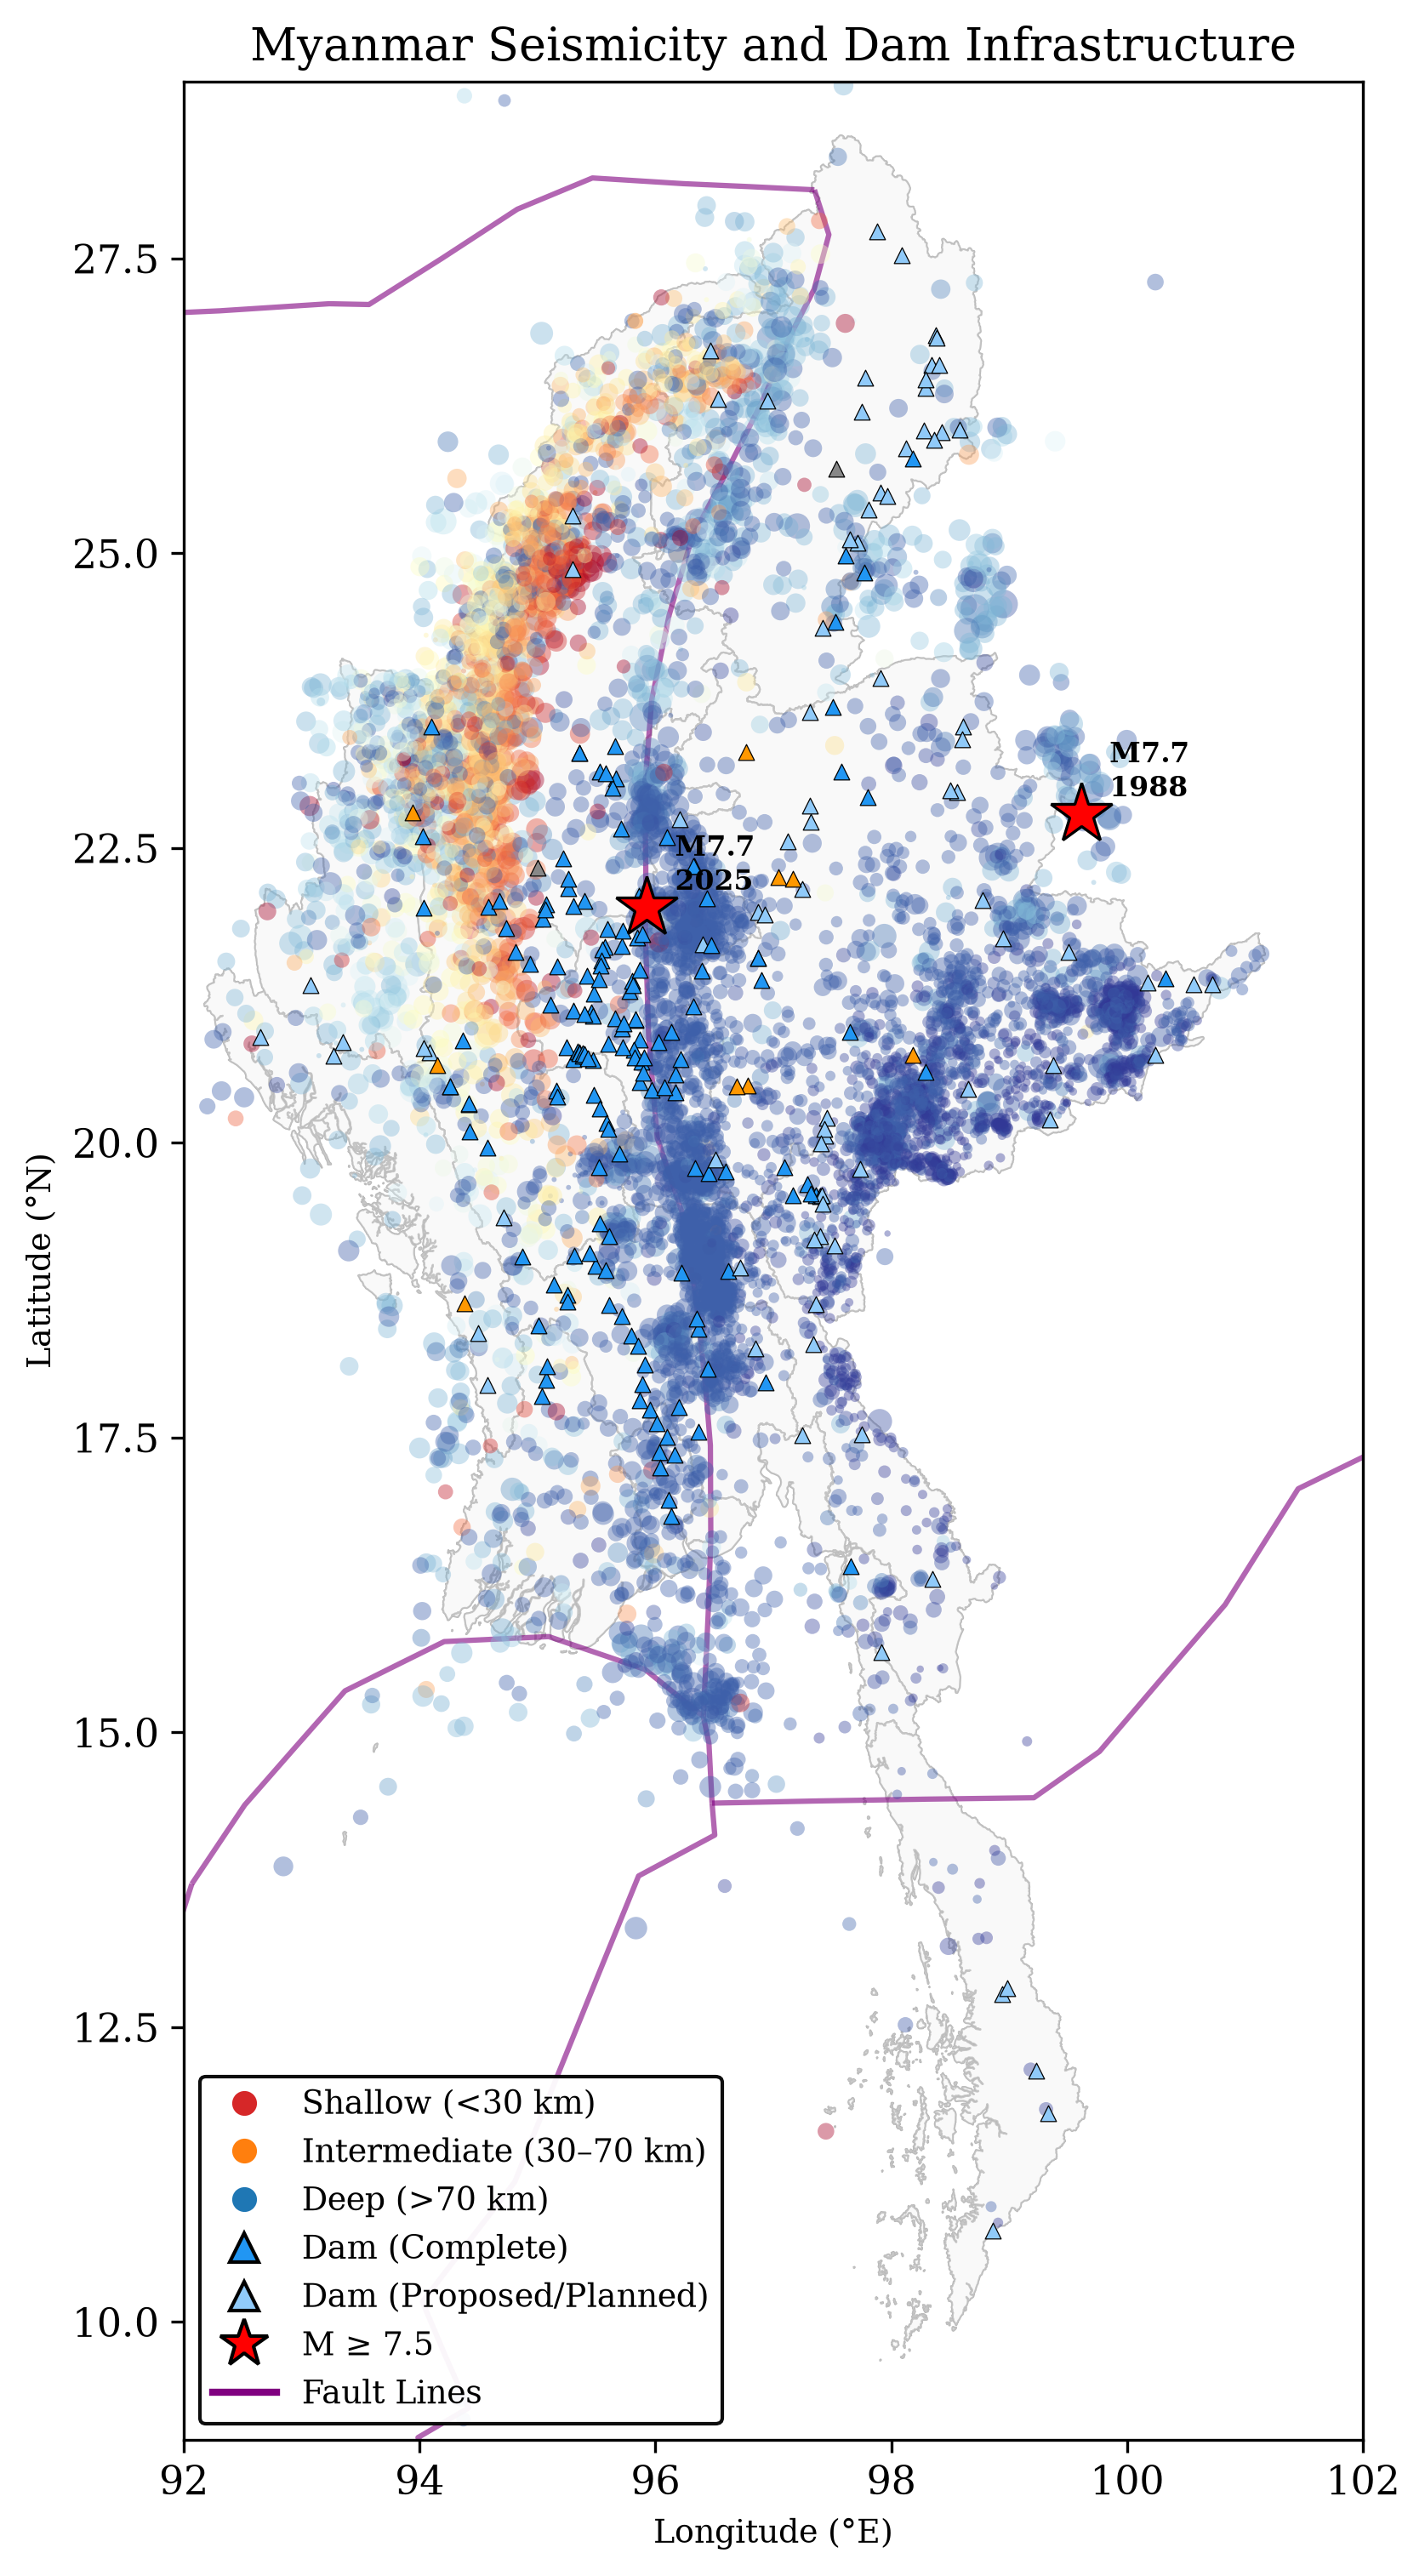
9,679 earthquakes with heatmap, fault lines, and 254 dams including the 2025 M7.7 rupture trace.
Open Map6-panel Plotly dashboard — timeline, depth, frequency-magnitude, mag-vs-depth, monthly counts, dam risk.
Open Dashboard3D earthquake hypocenters along the Sagaing Fault, color-coded by depth.
Open 3DMonth-by-month earthquake progression from 1970 to present. Watch the 2025 aftershock sequence.
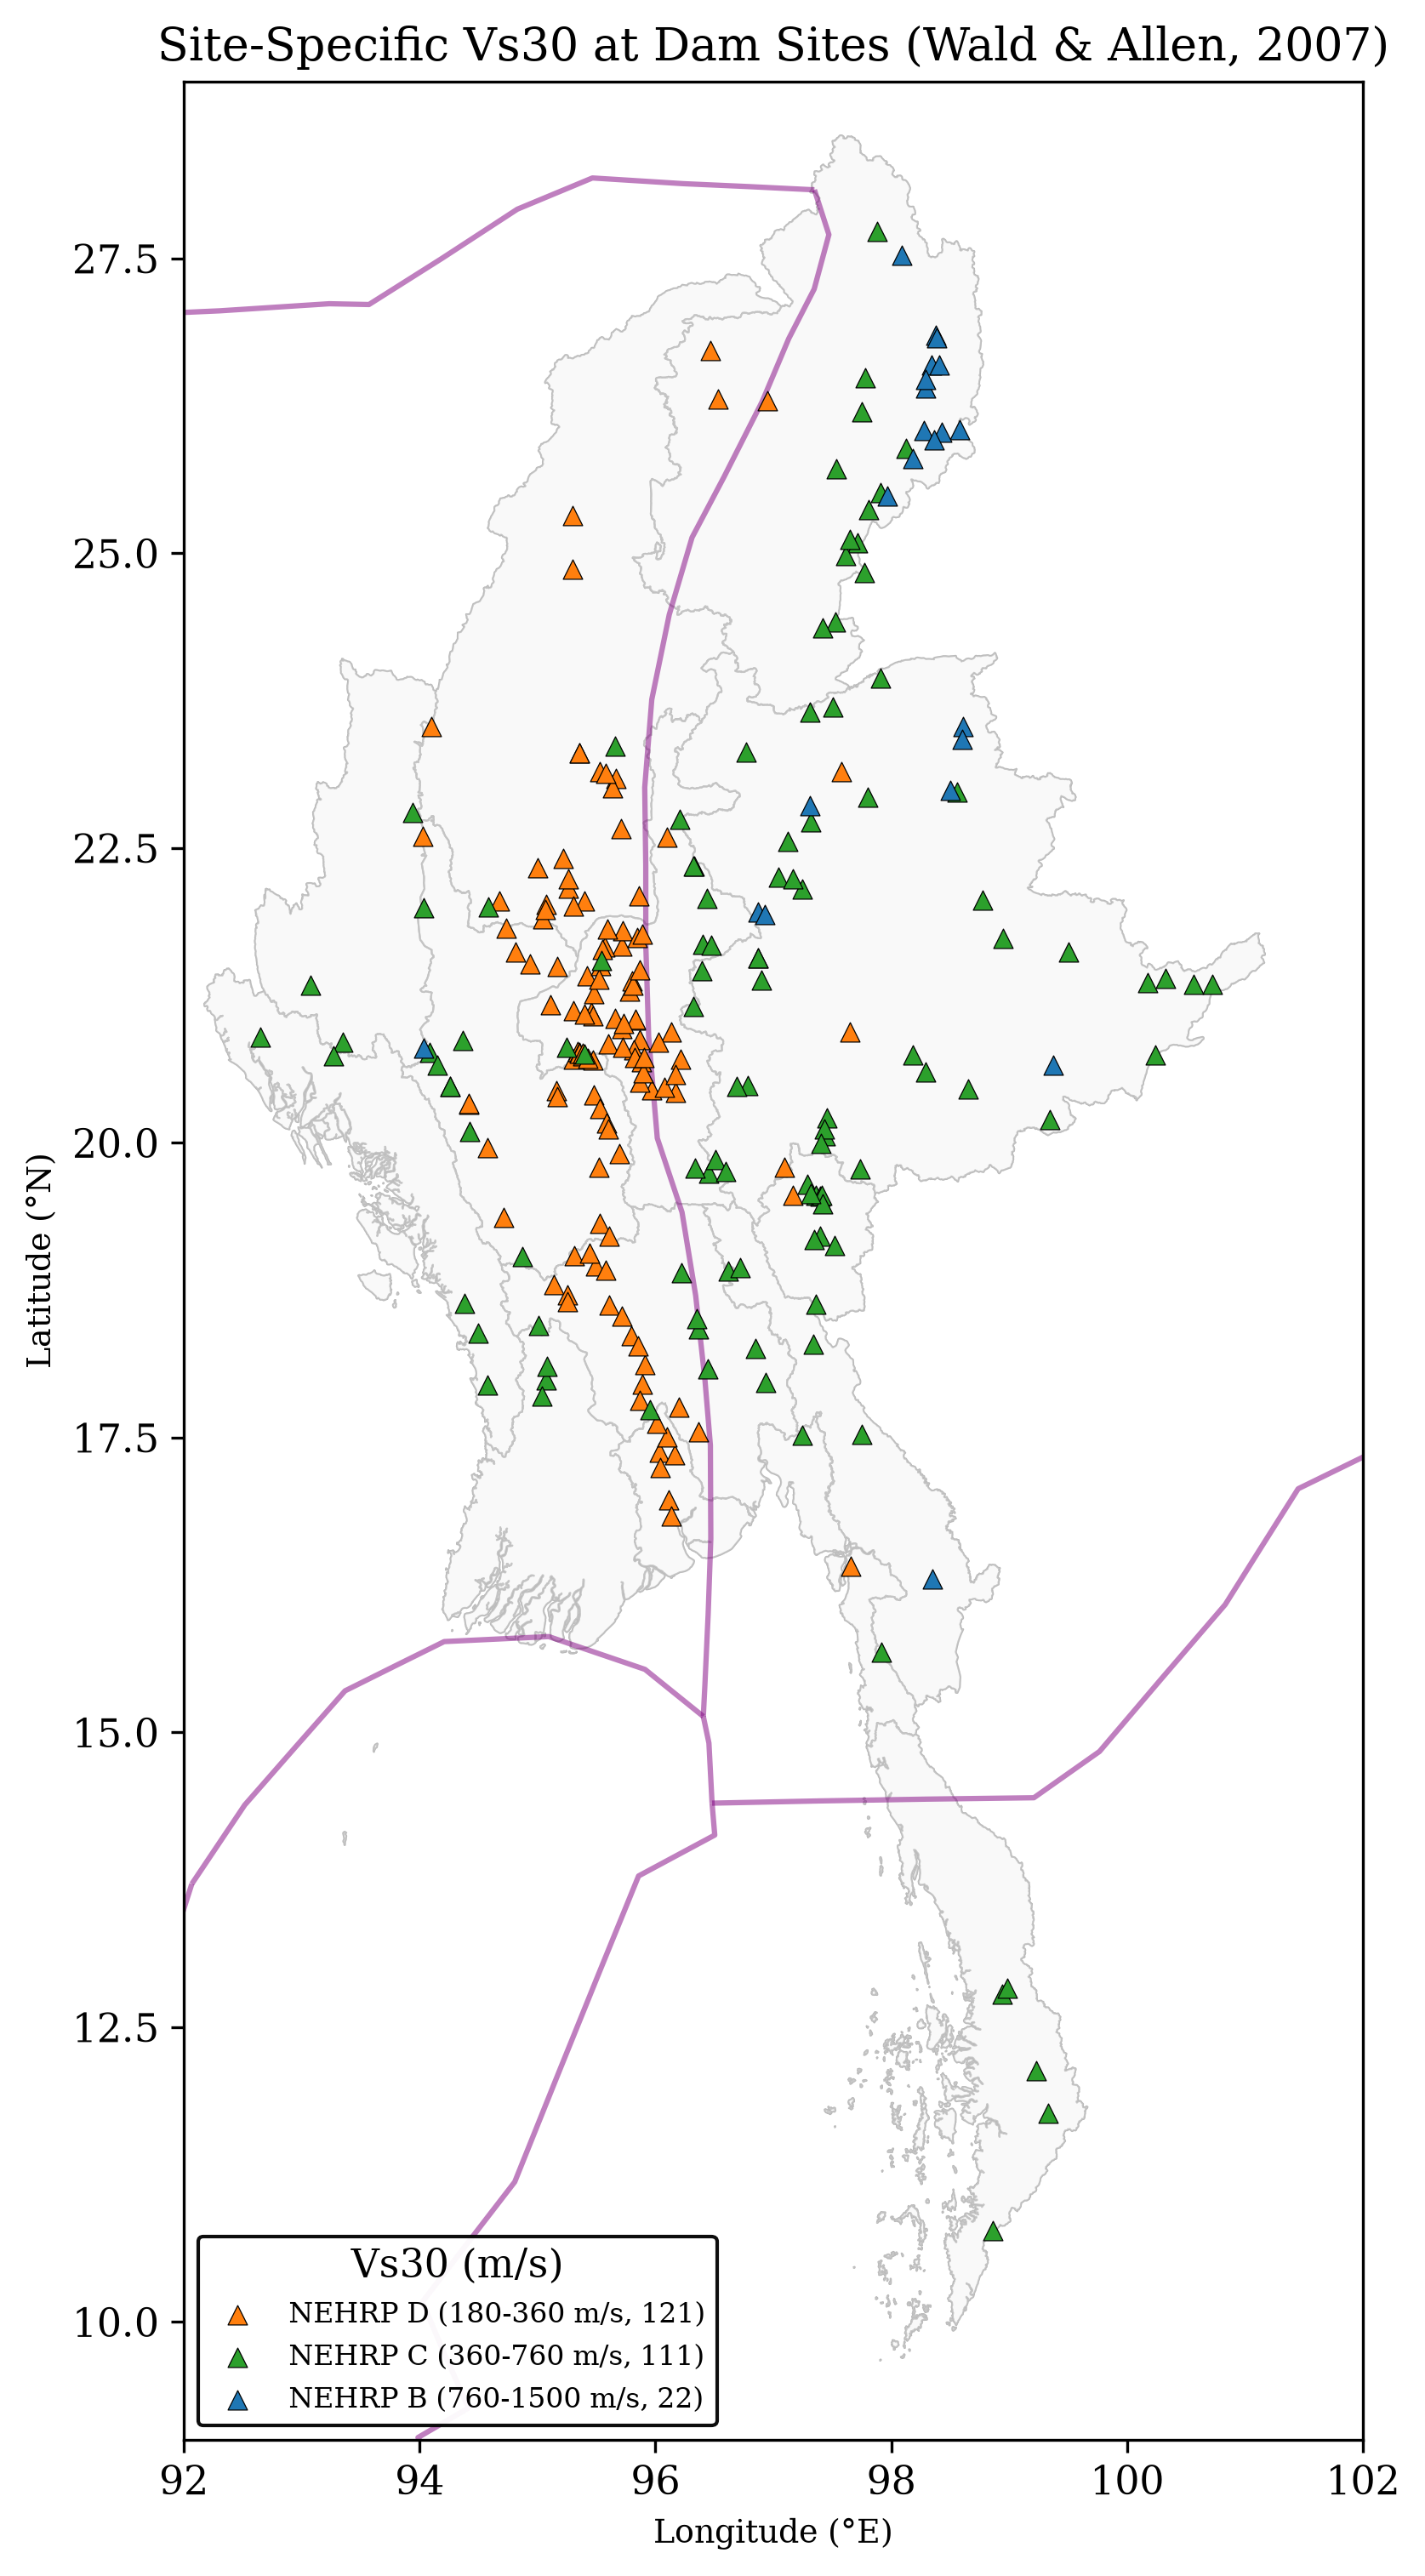
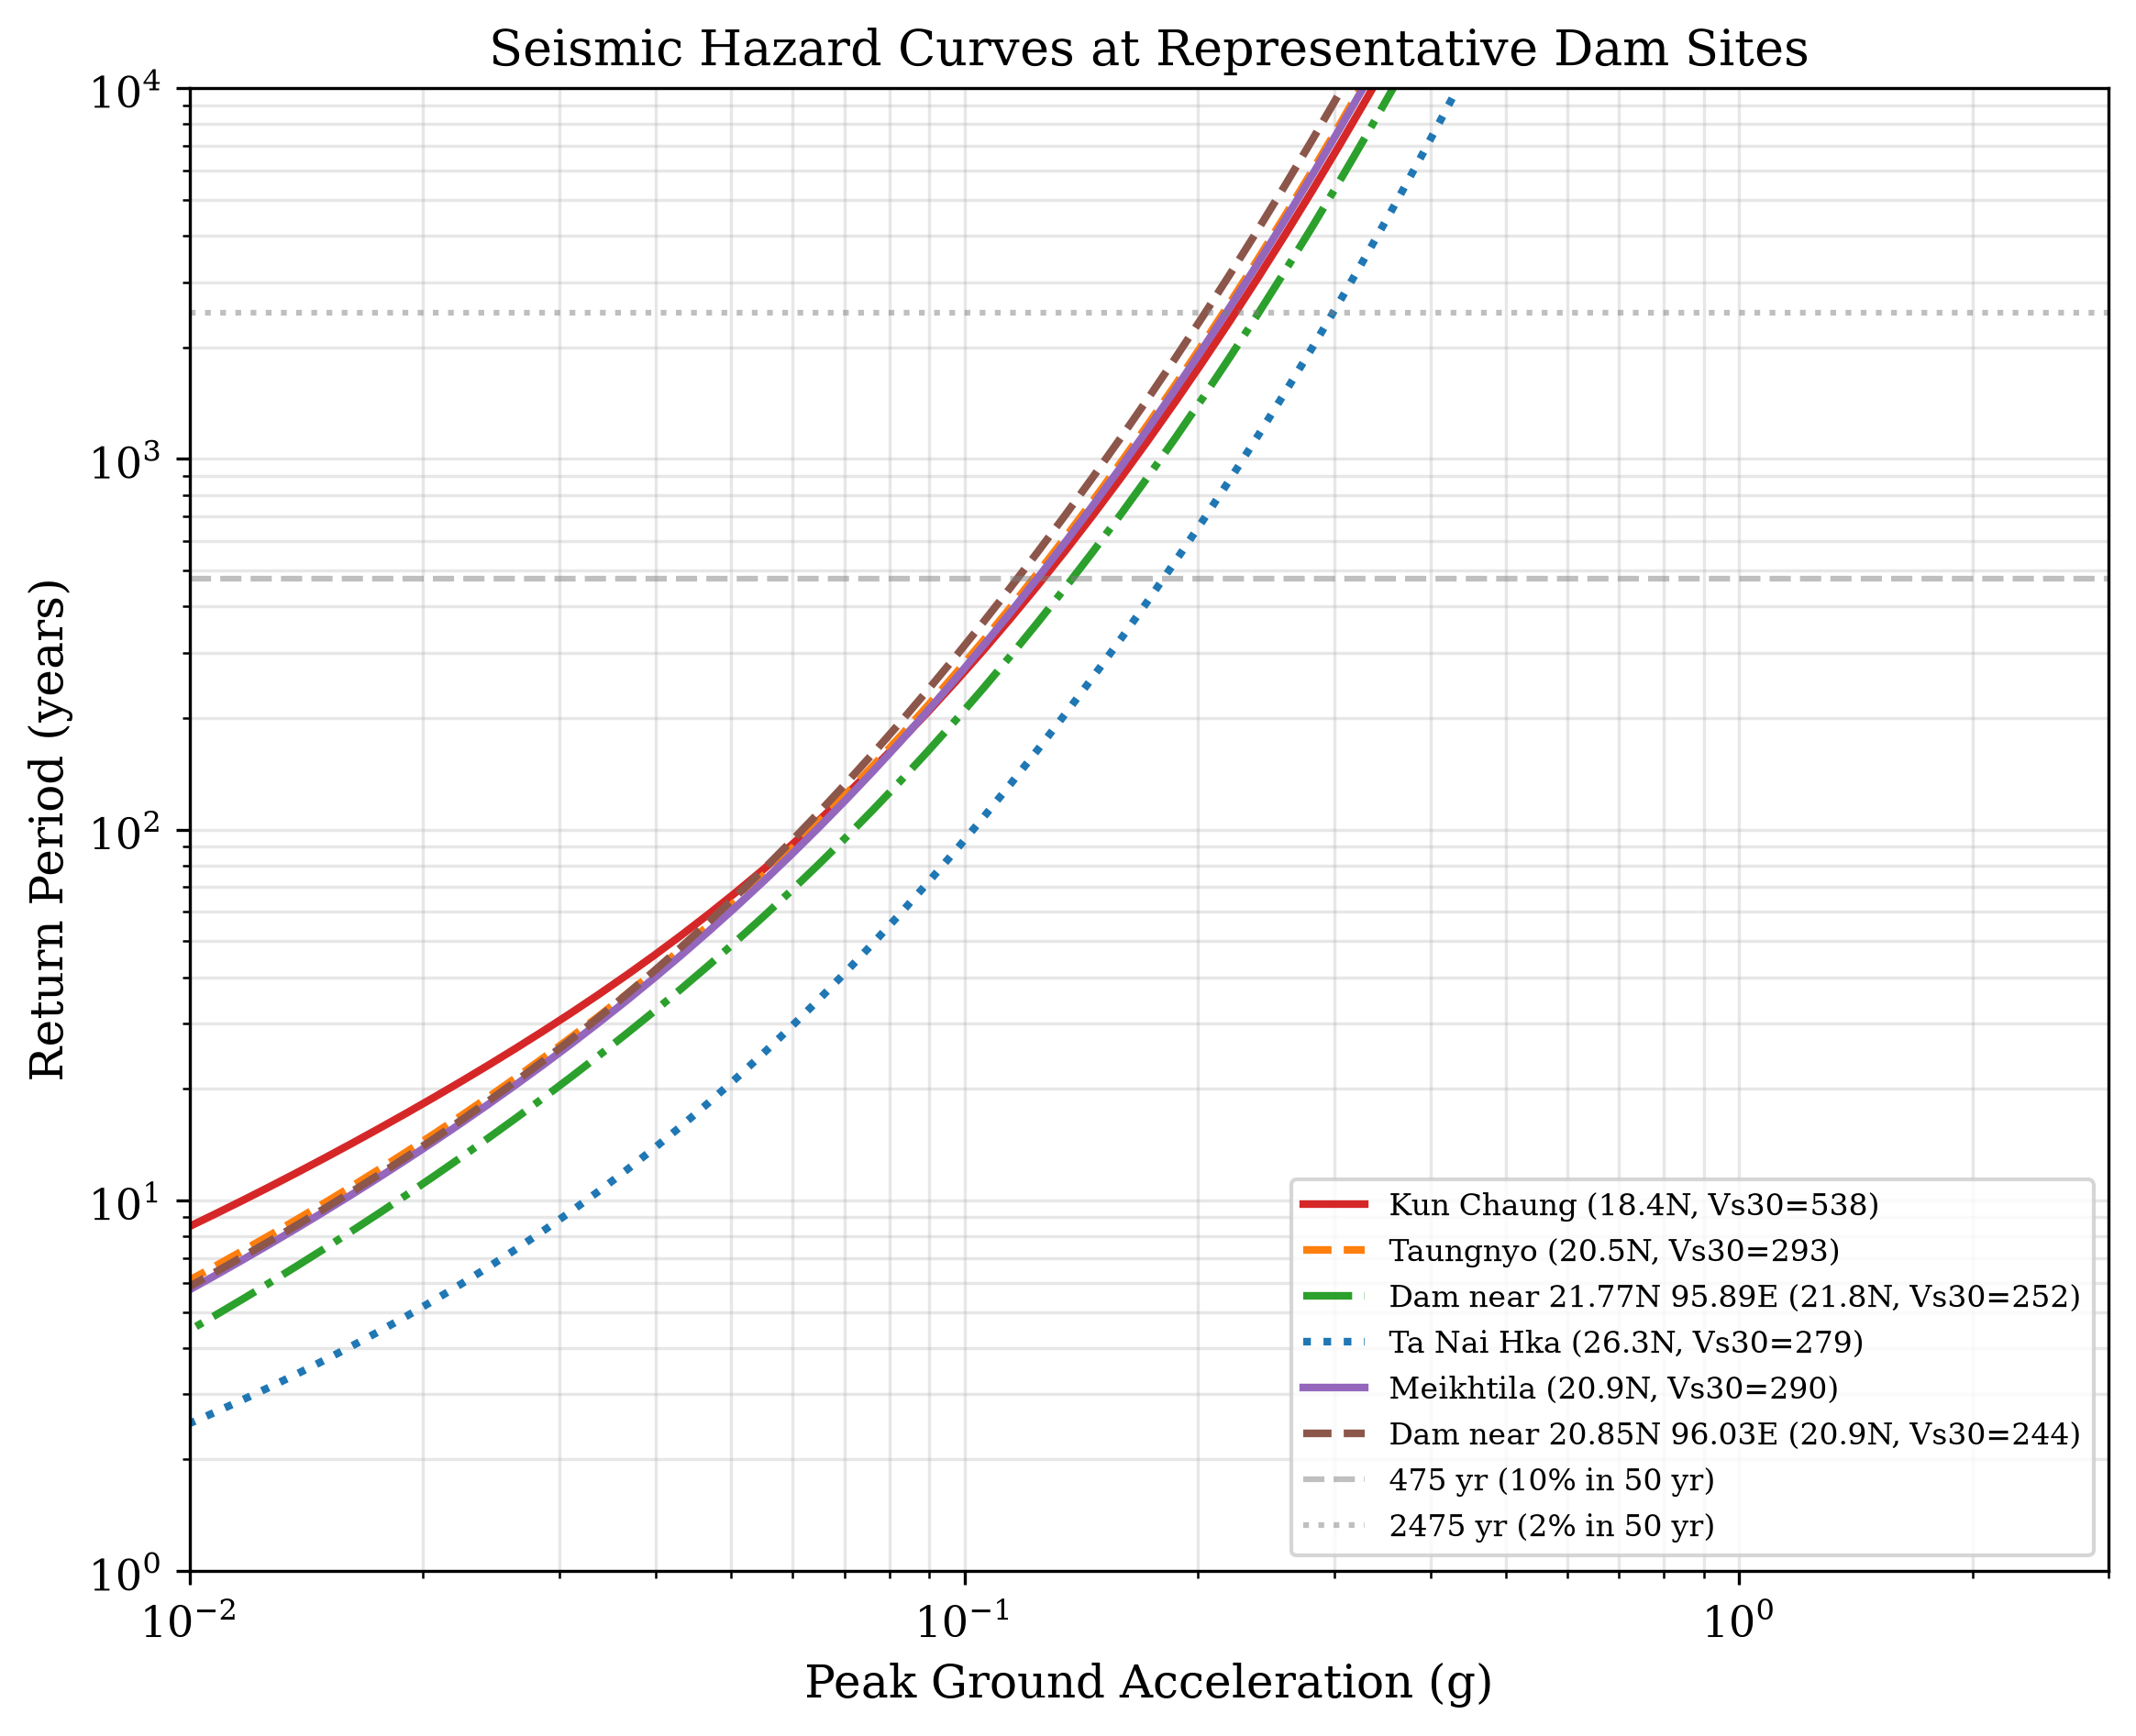
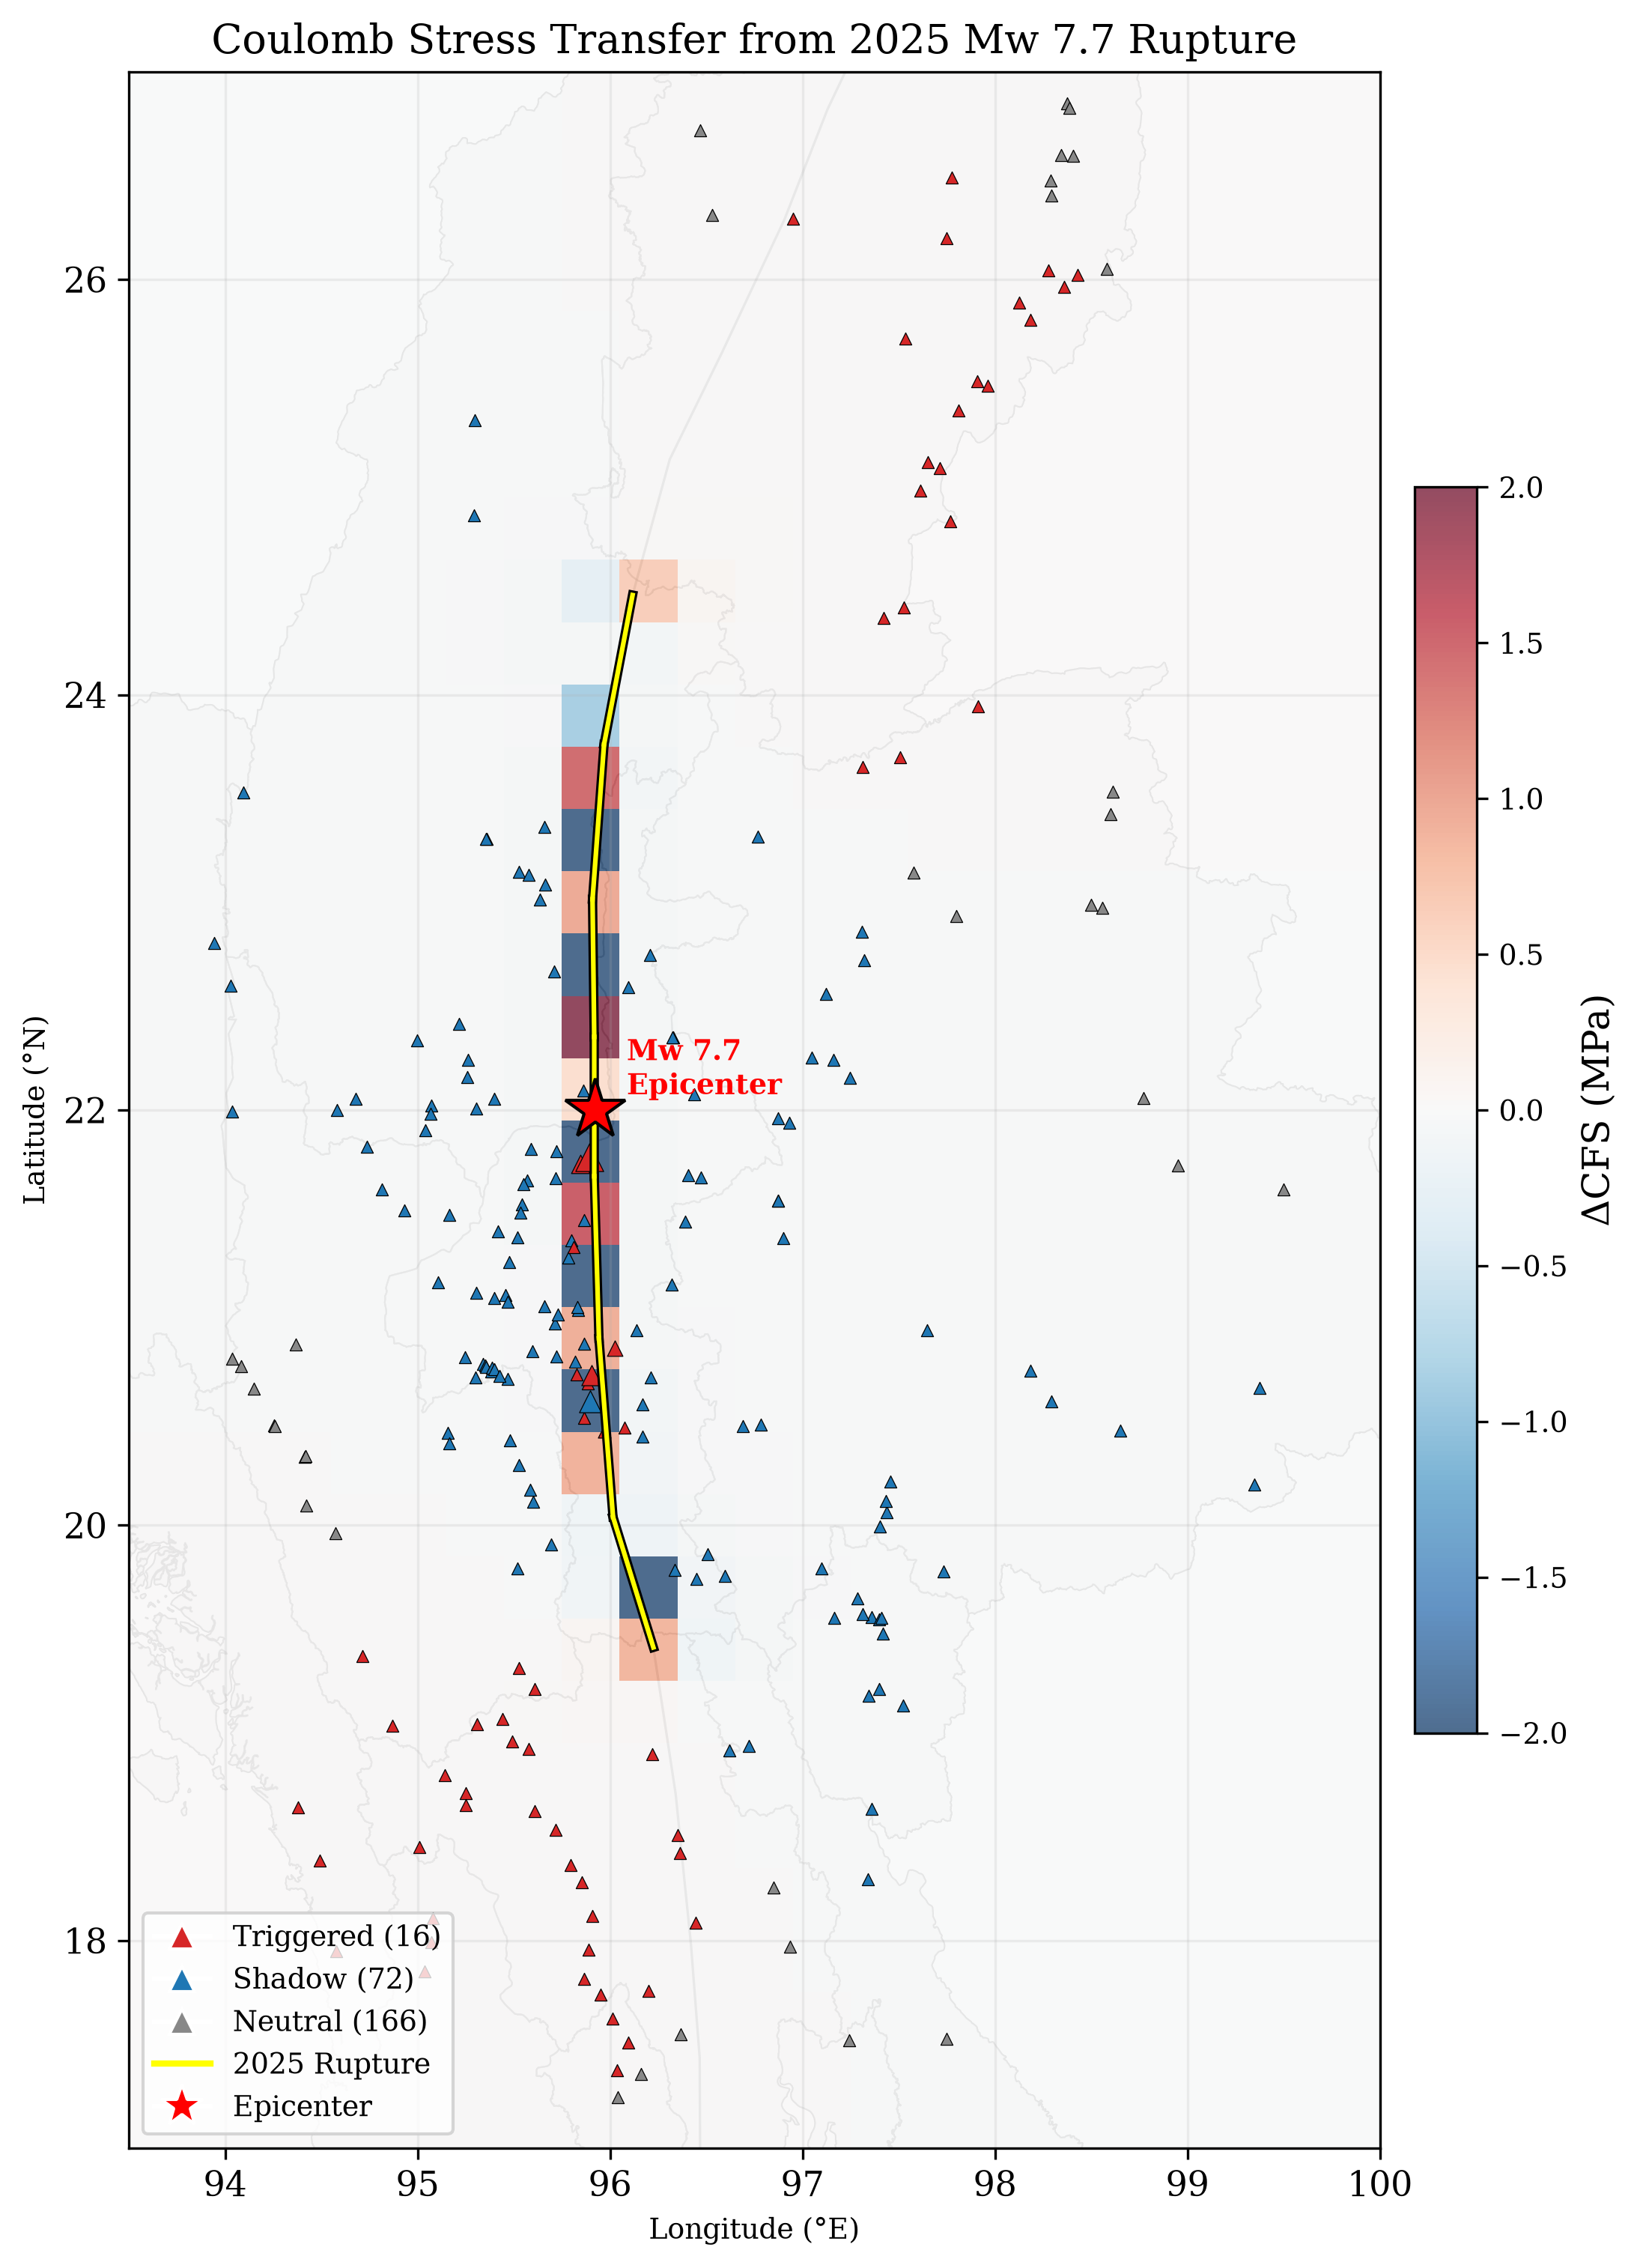
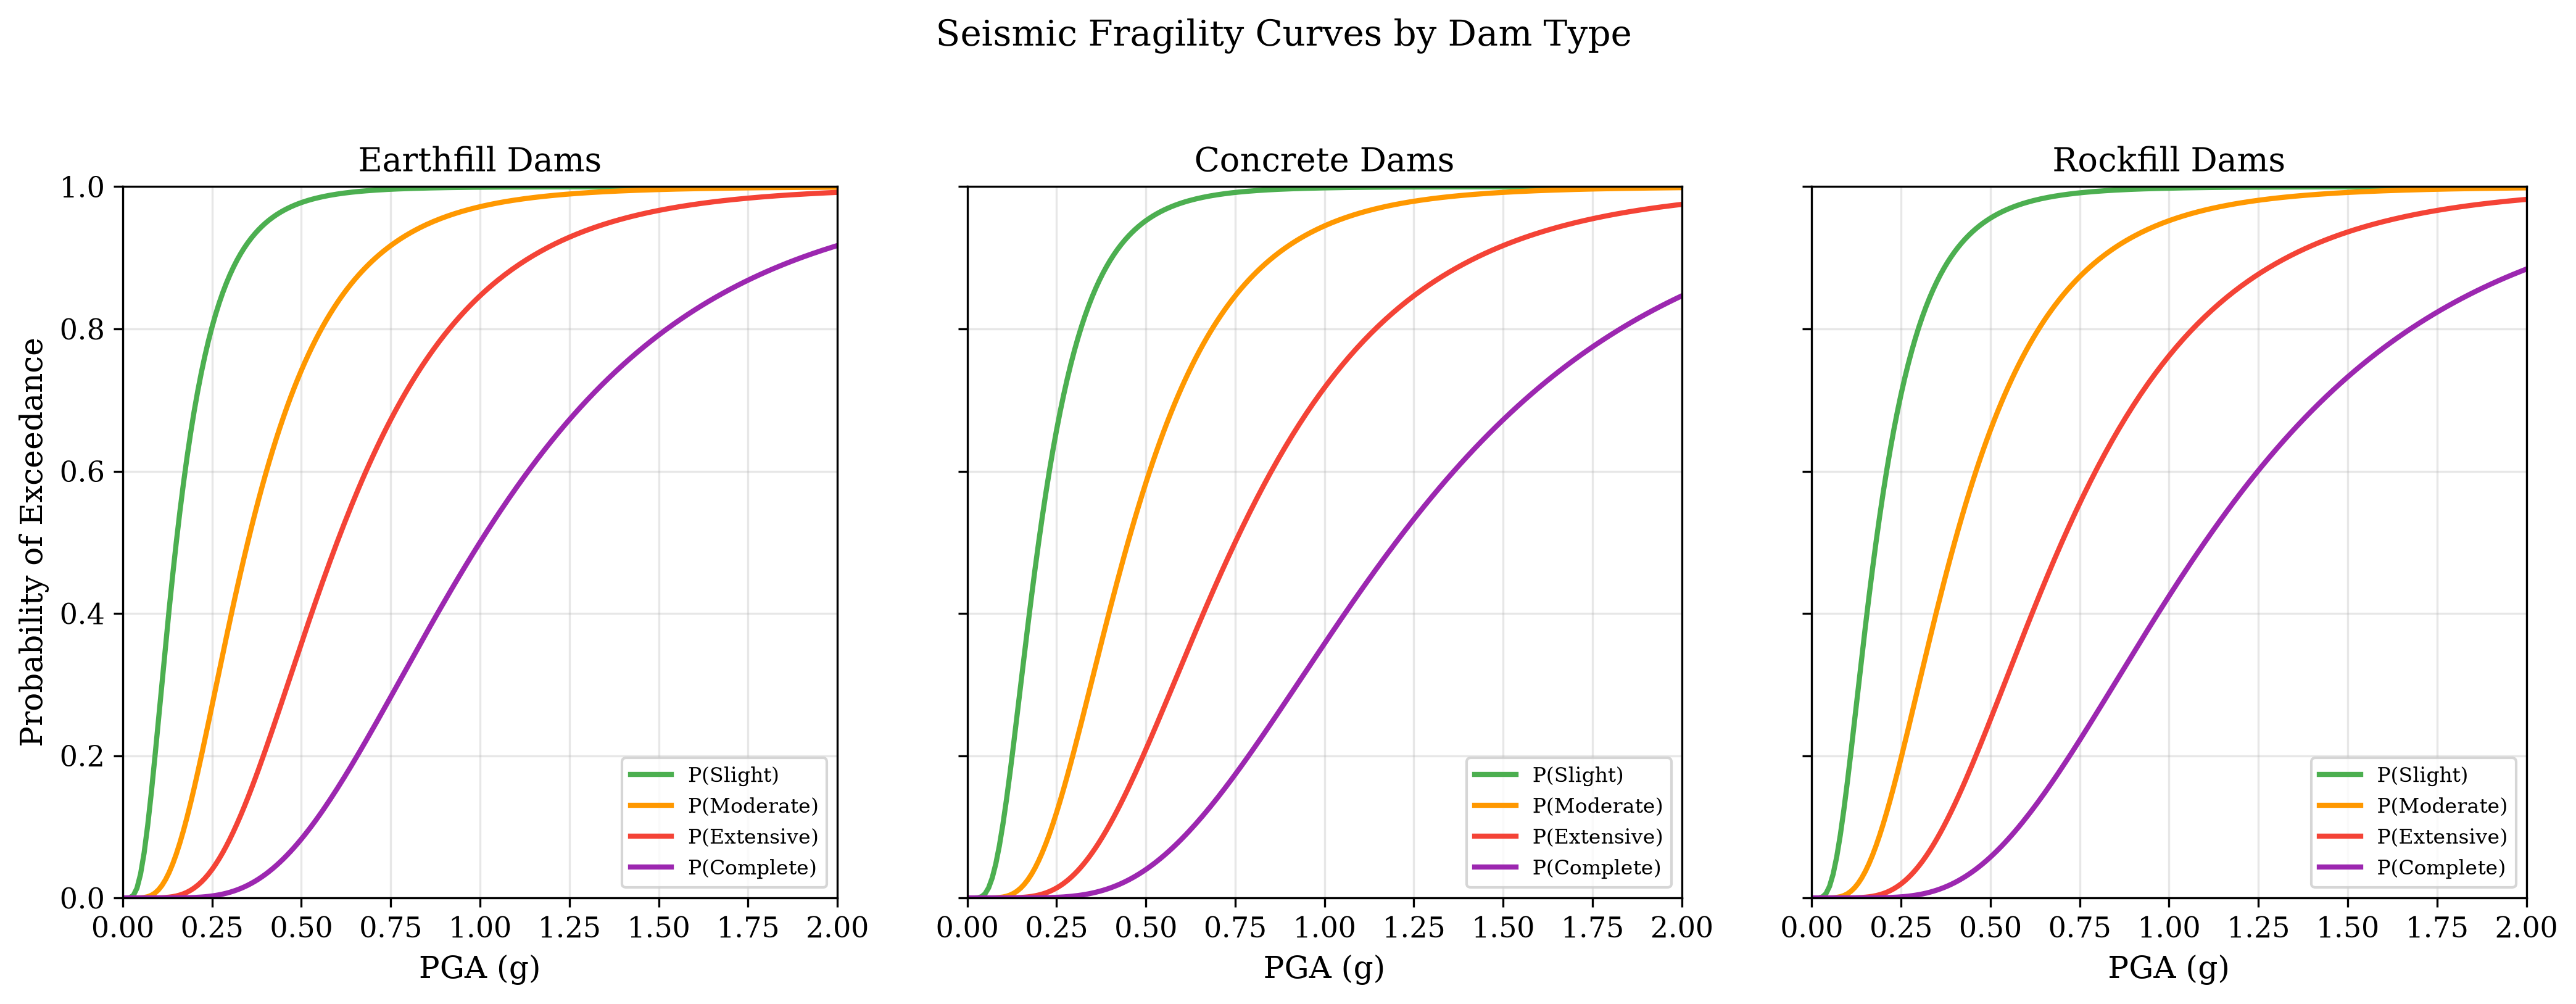
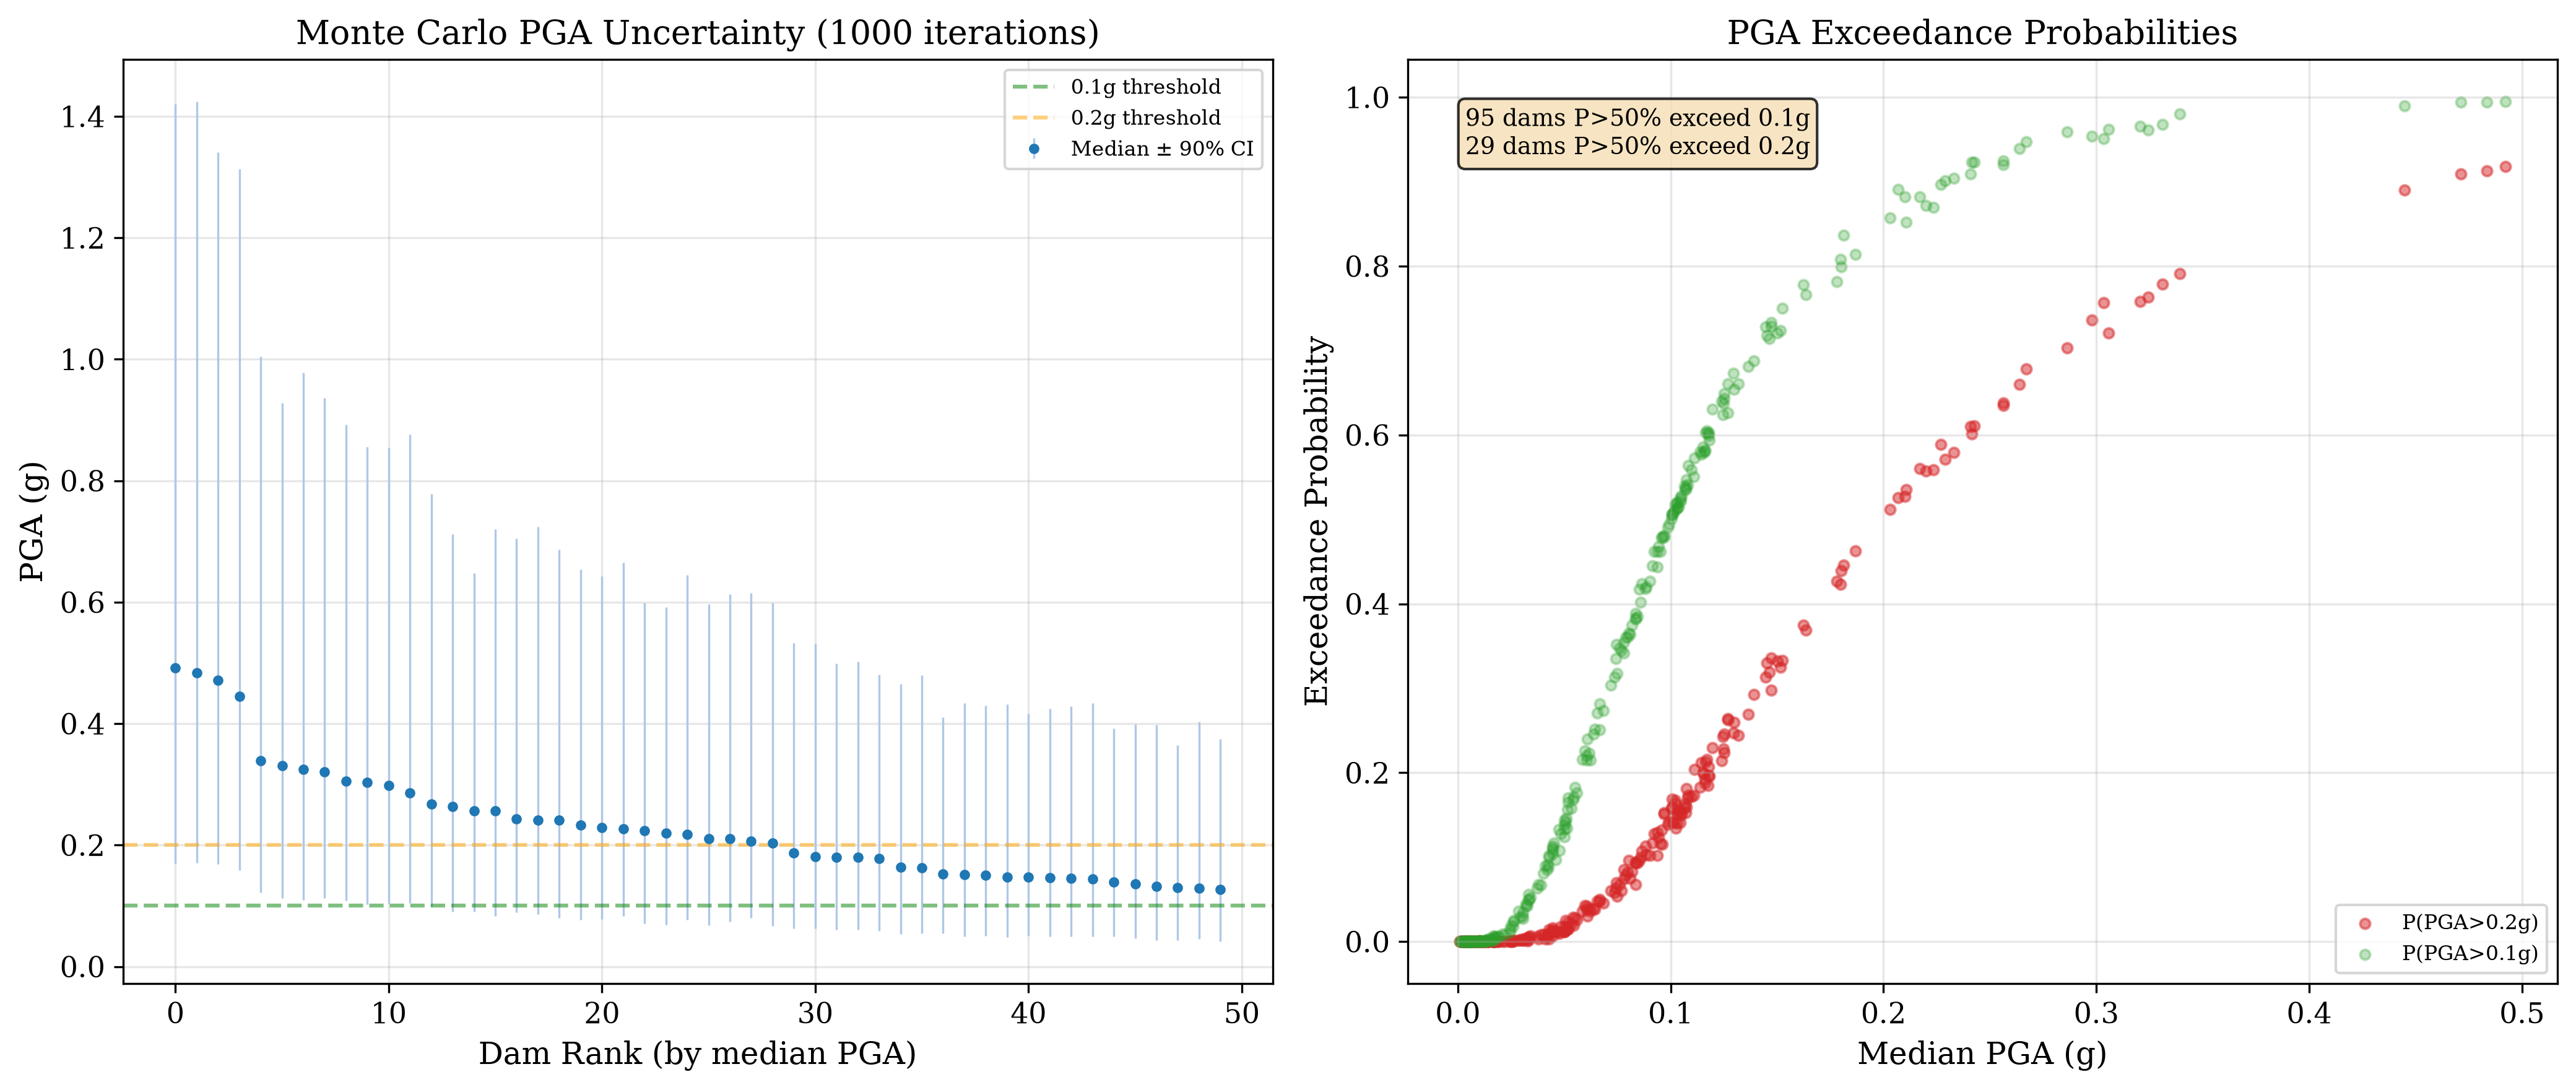
Open Animation17-page hobby write-up — dam risk, GMPE validation, Coulomb stress, fragility, building exposure, HAZUS loss estimates.
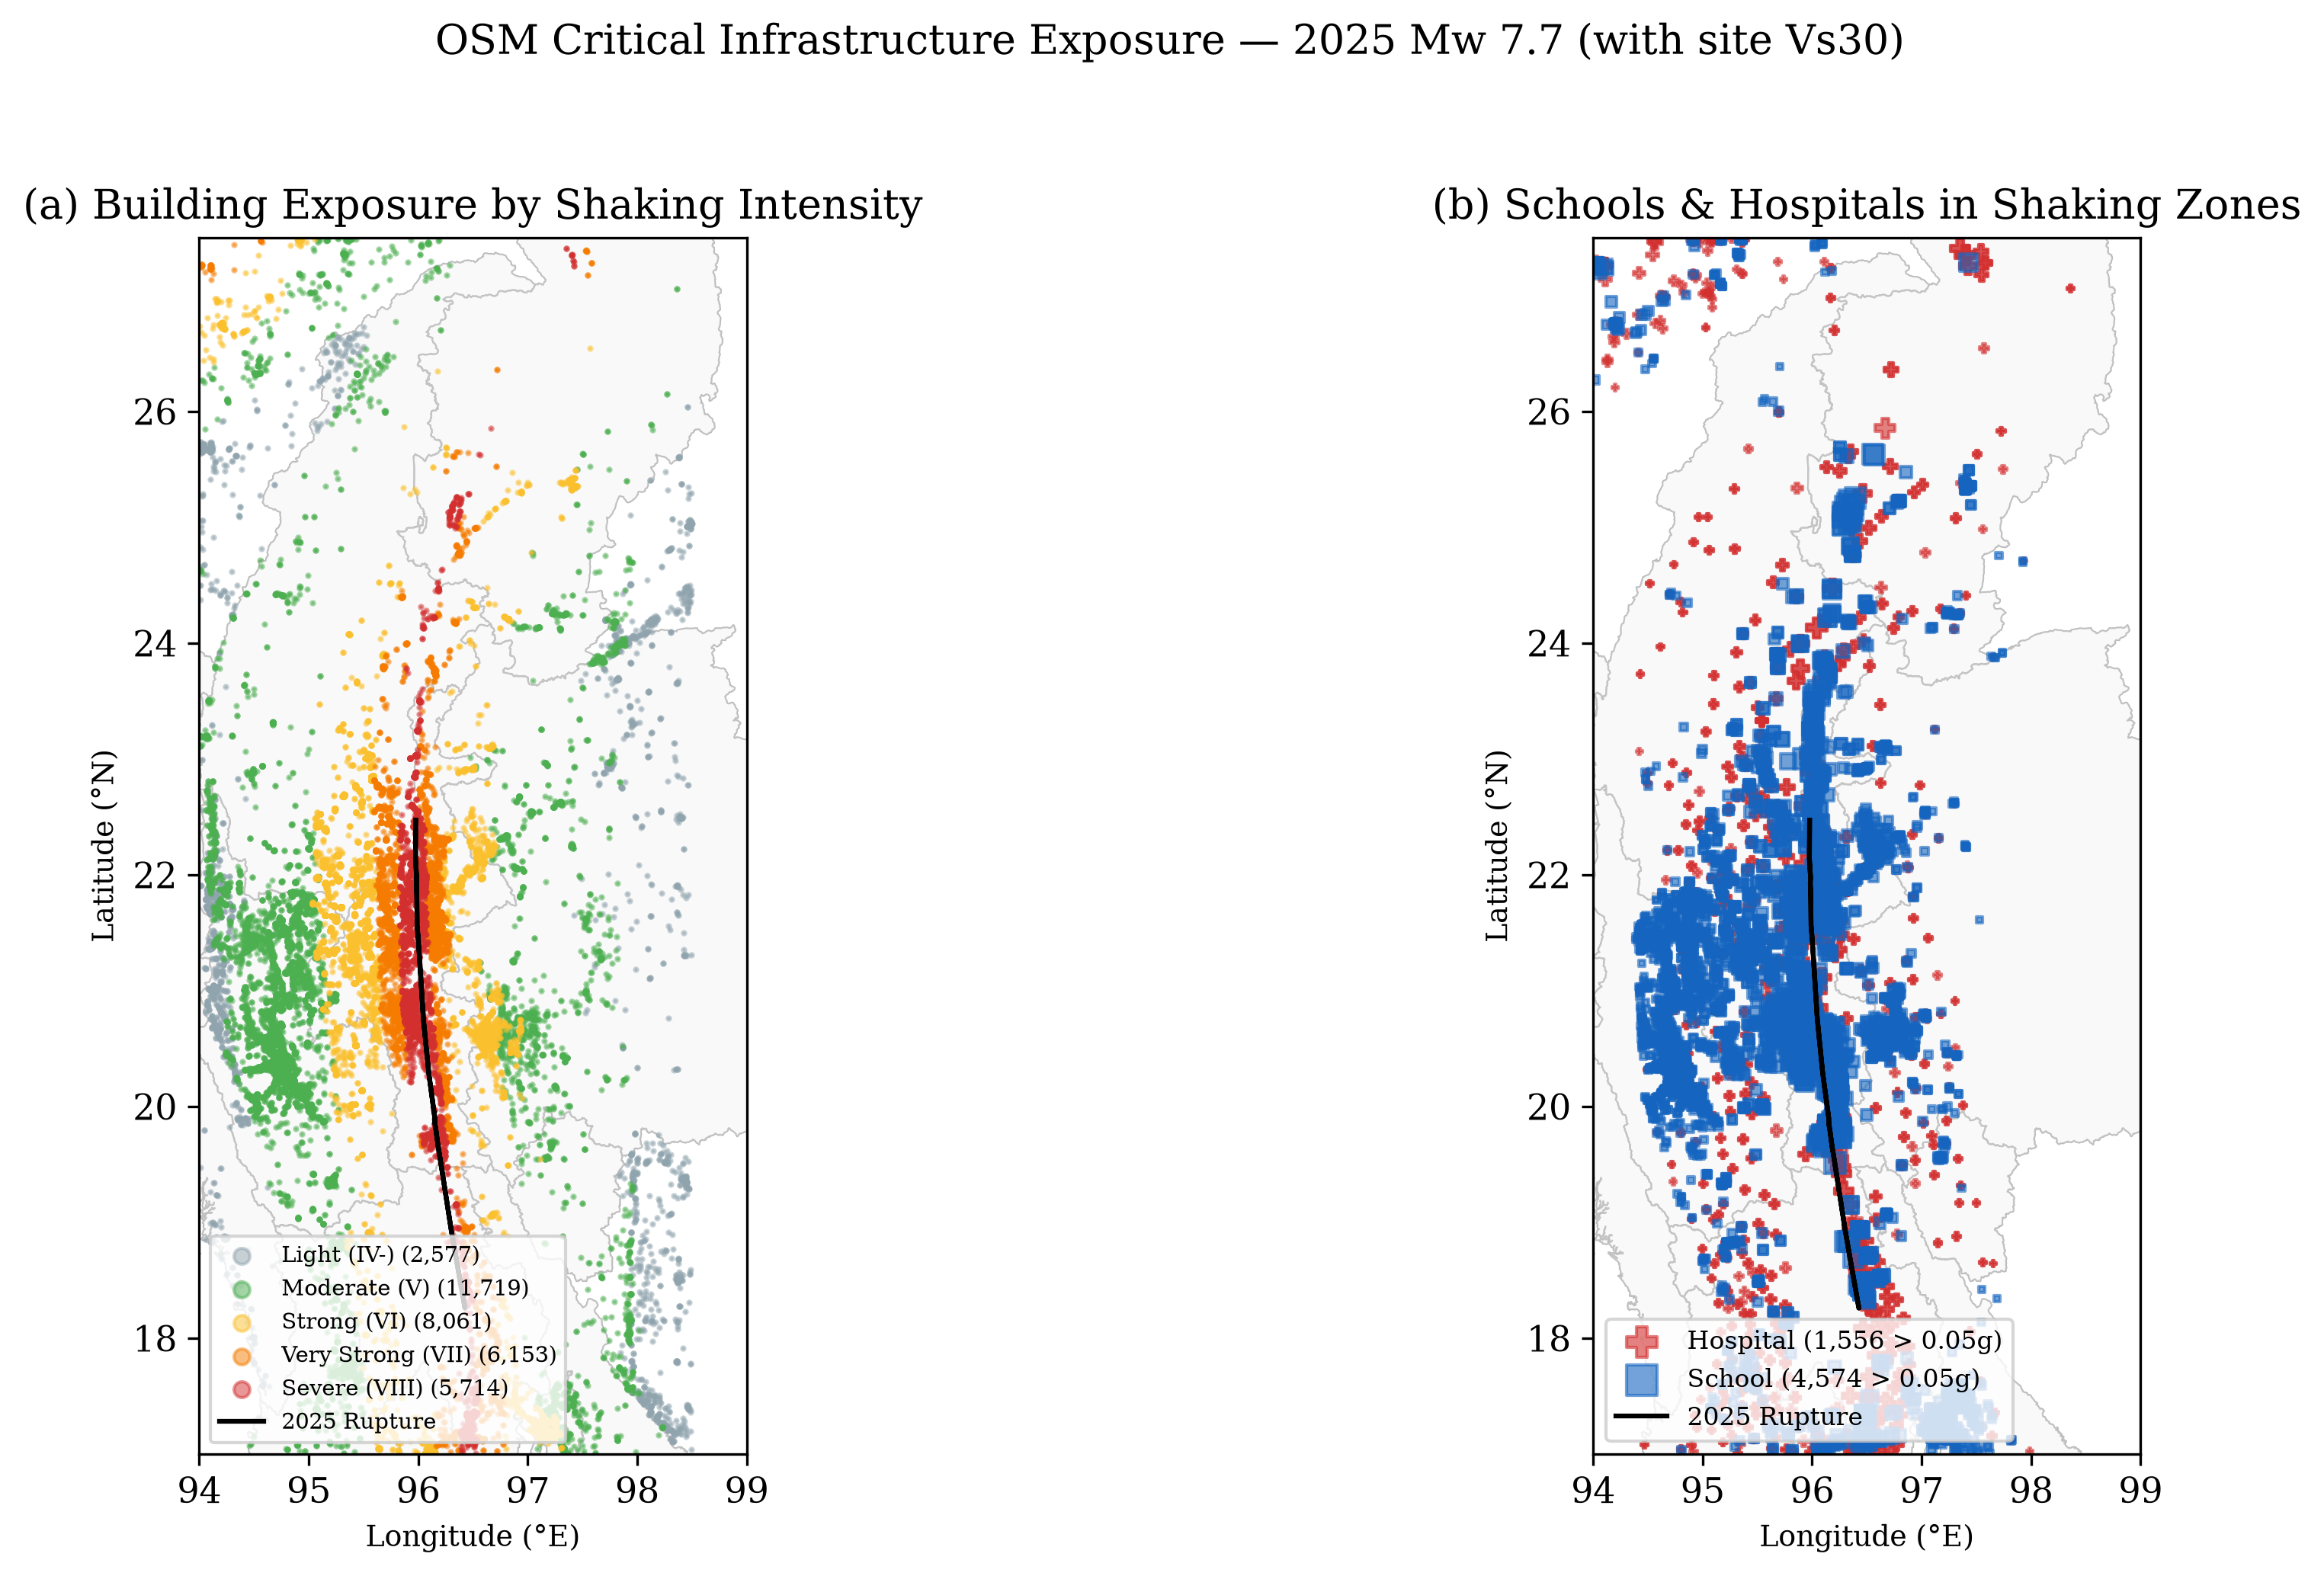
Read PDF34,224 schools, hospitals, and critical buildings with site-specific Vs30. 2,166 schools and 901 hospitals above 0.1g PGA.
Download CSV (4.3 MB)Dam Risk & Exposure Data
🌀 Earthquake Data Explorer
Download earthquake records by year. Includes lat, lon, depth, magnitude, state/region, district, township, nearest village, and distance.
nearest_city, place_type, distance_km, state_region, district, and township are included in every file.
The raw places database (74K villages/towns/cities) is also available:
Myanmar Places CSV (4.5 MB)
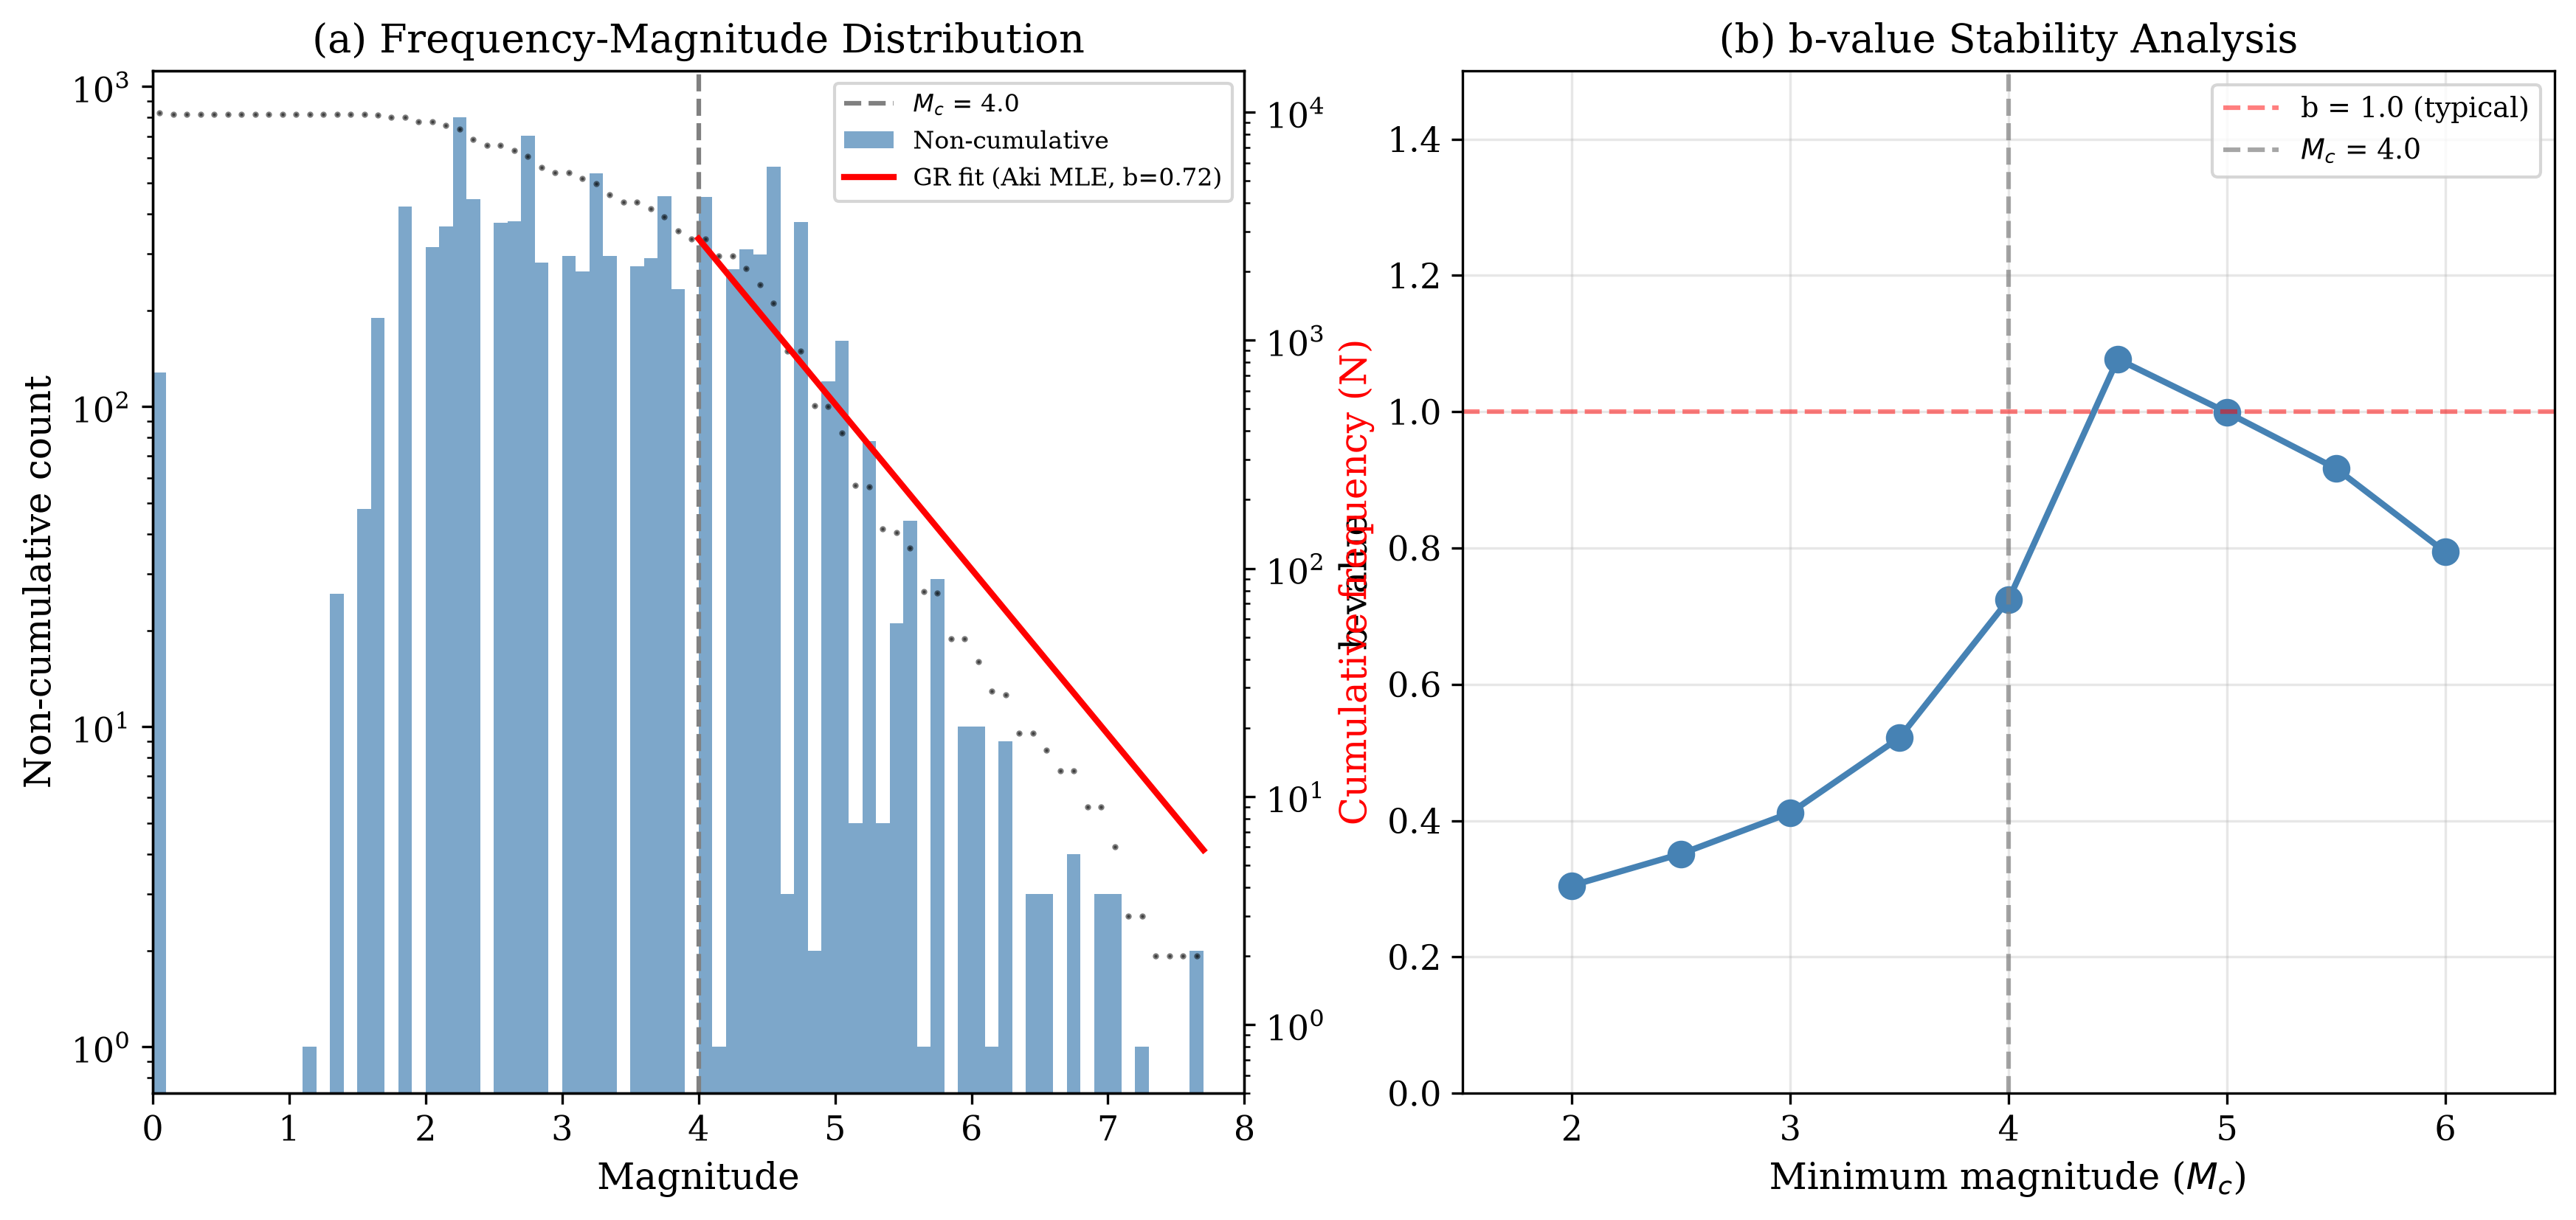
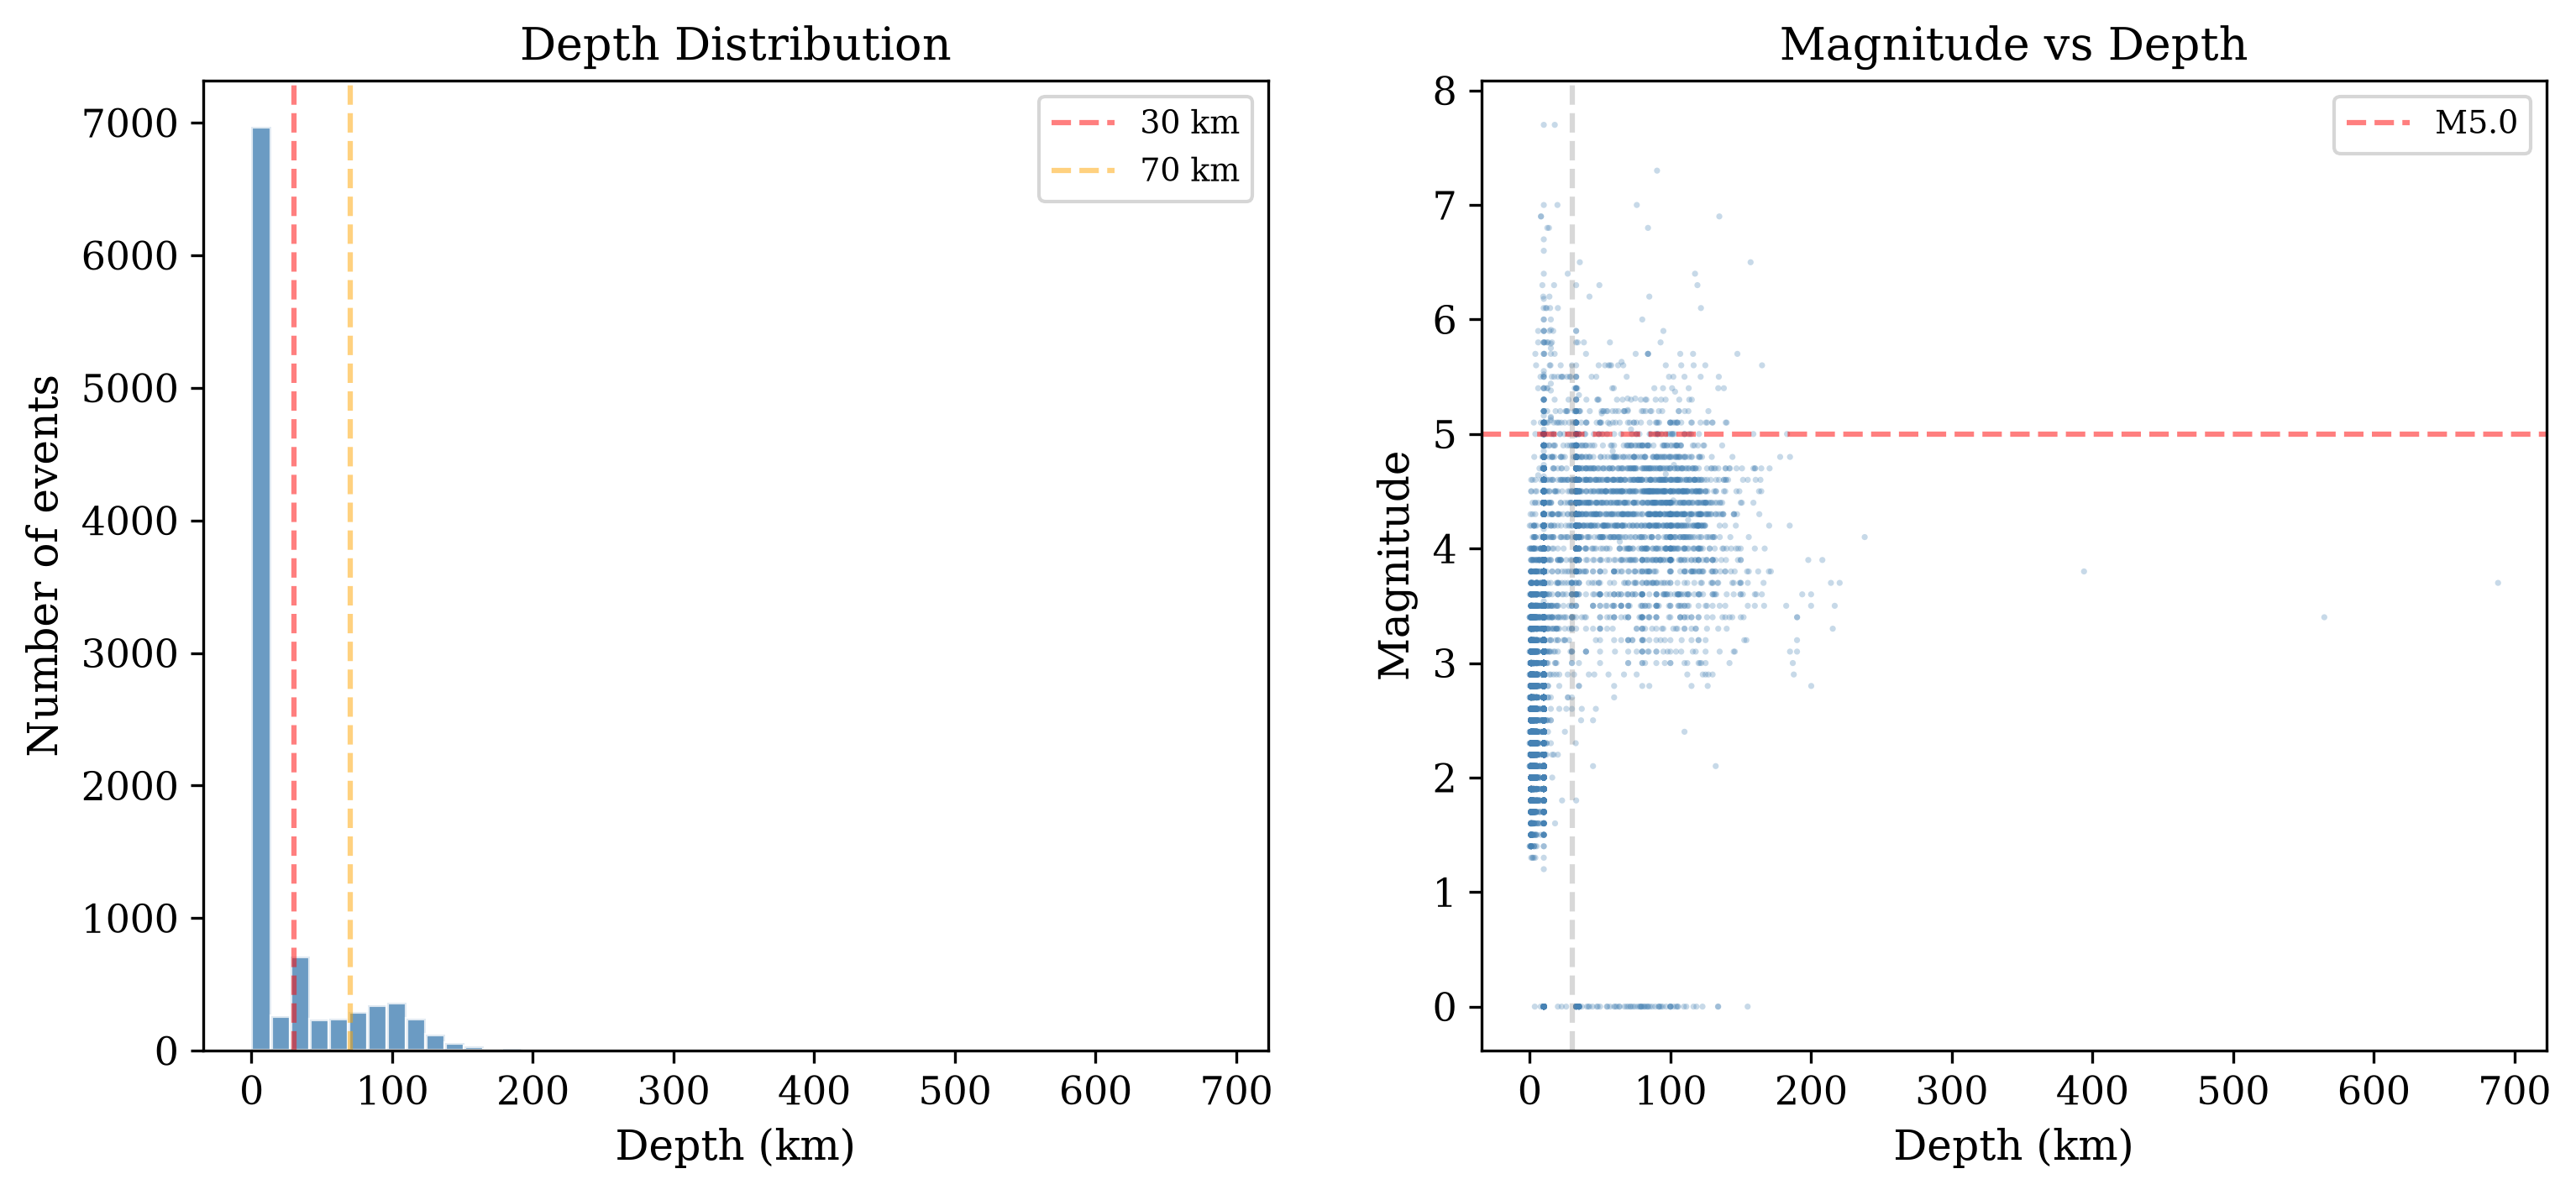
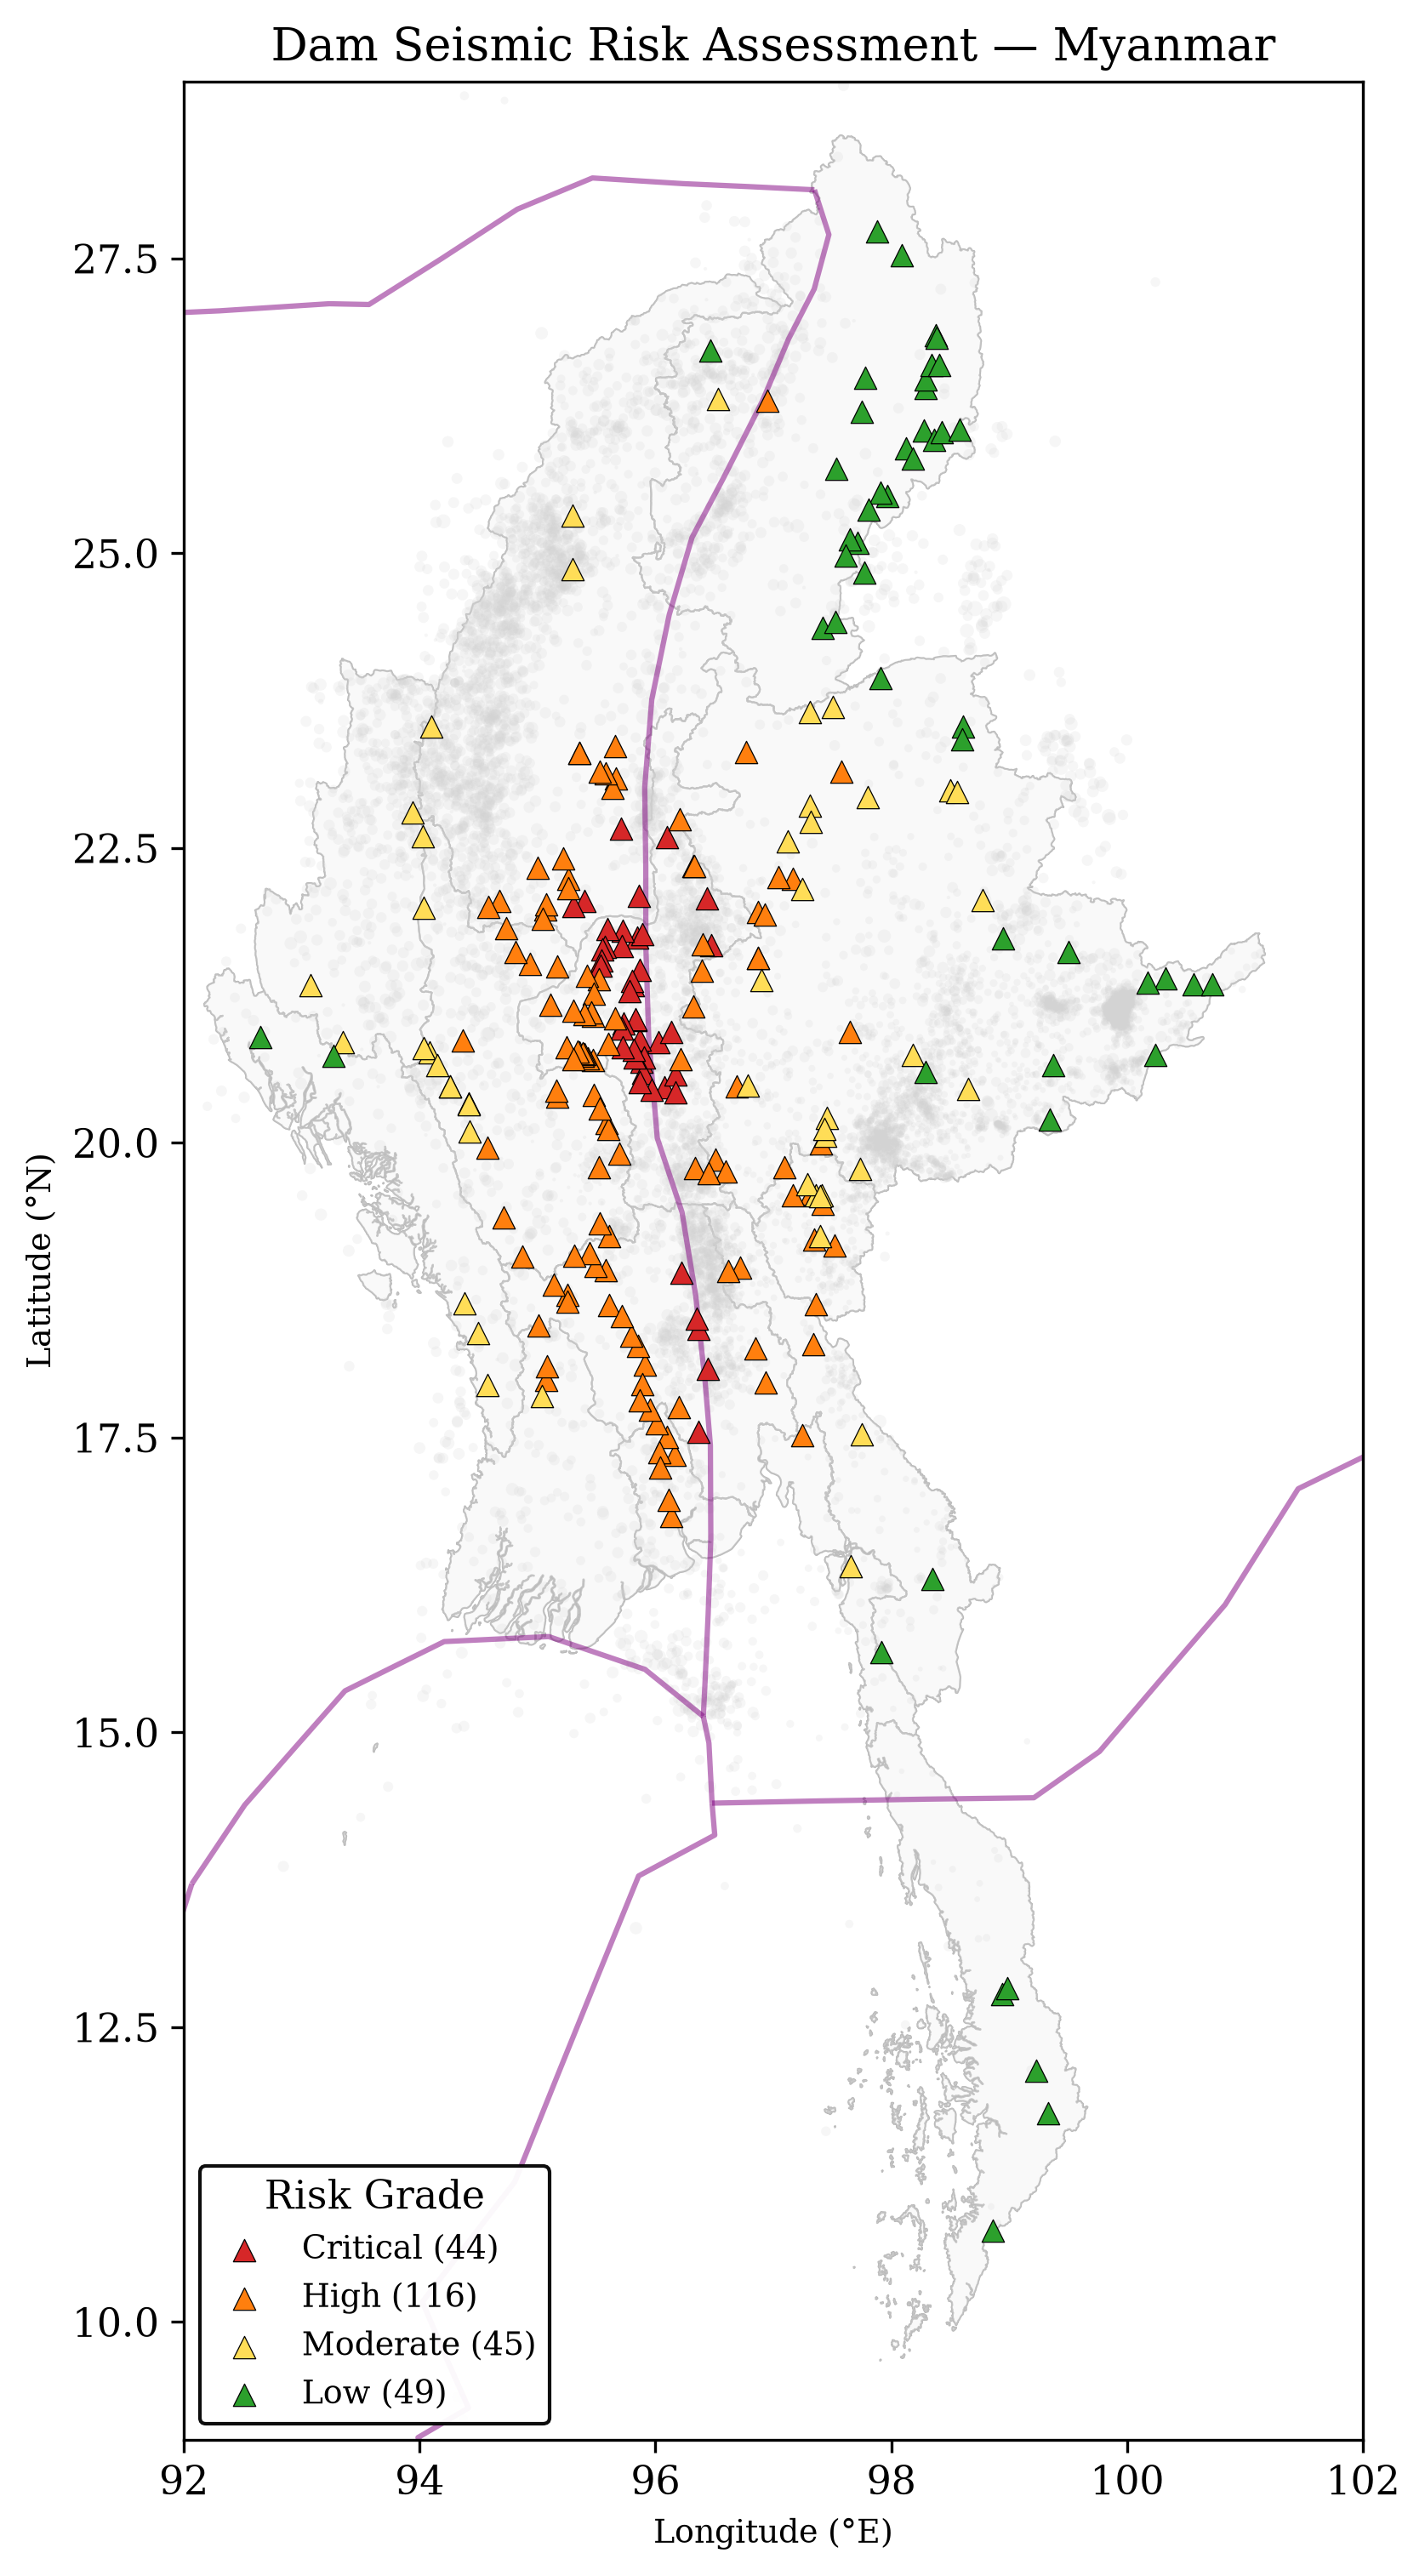
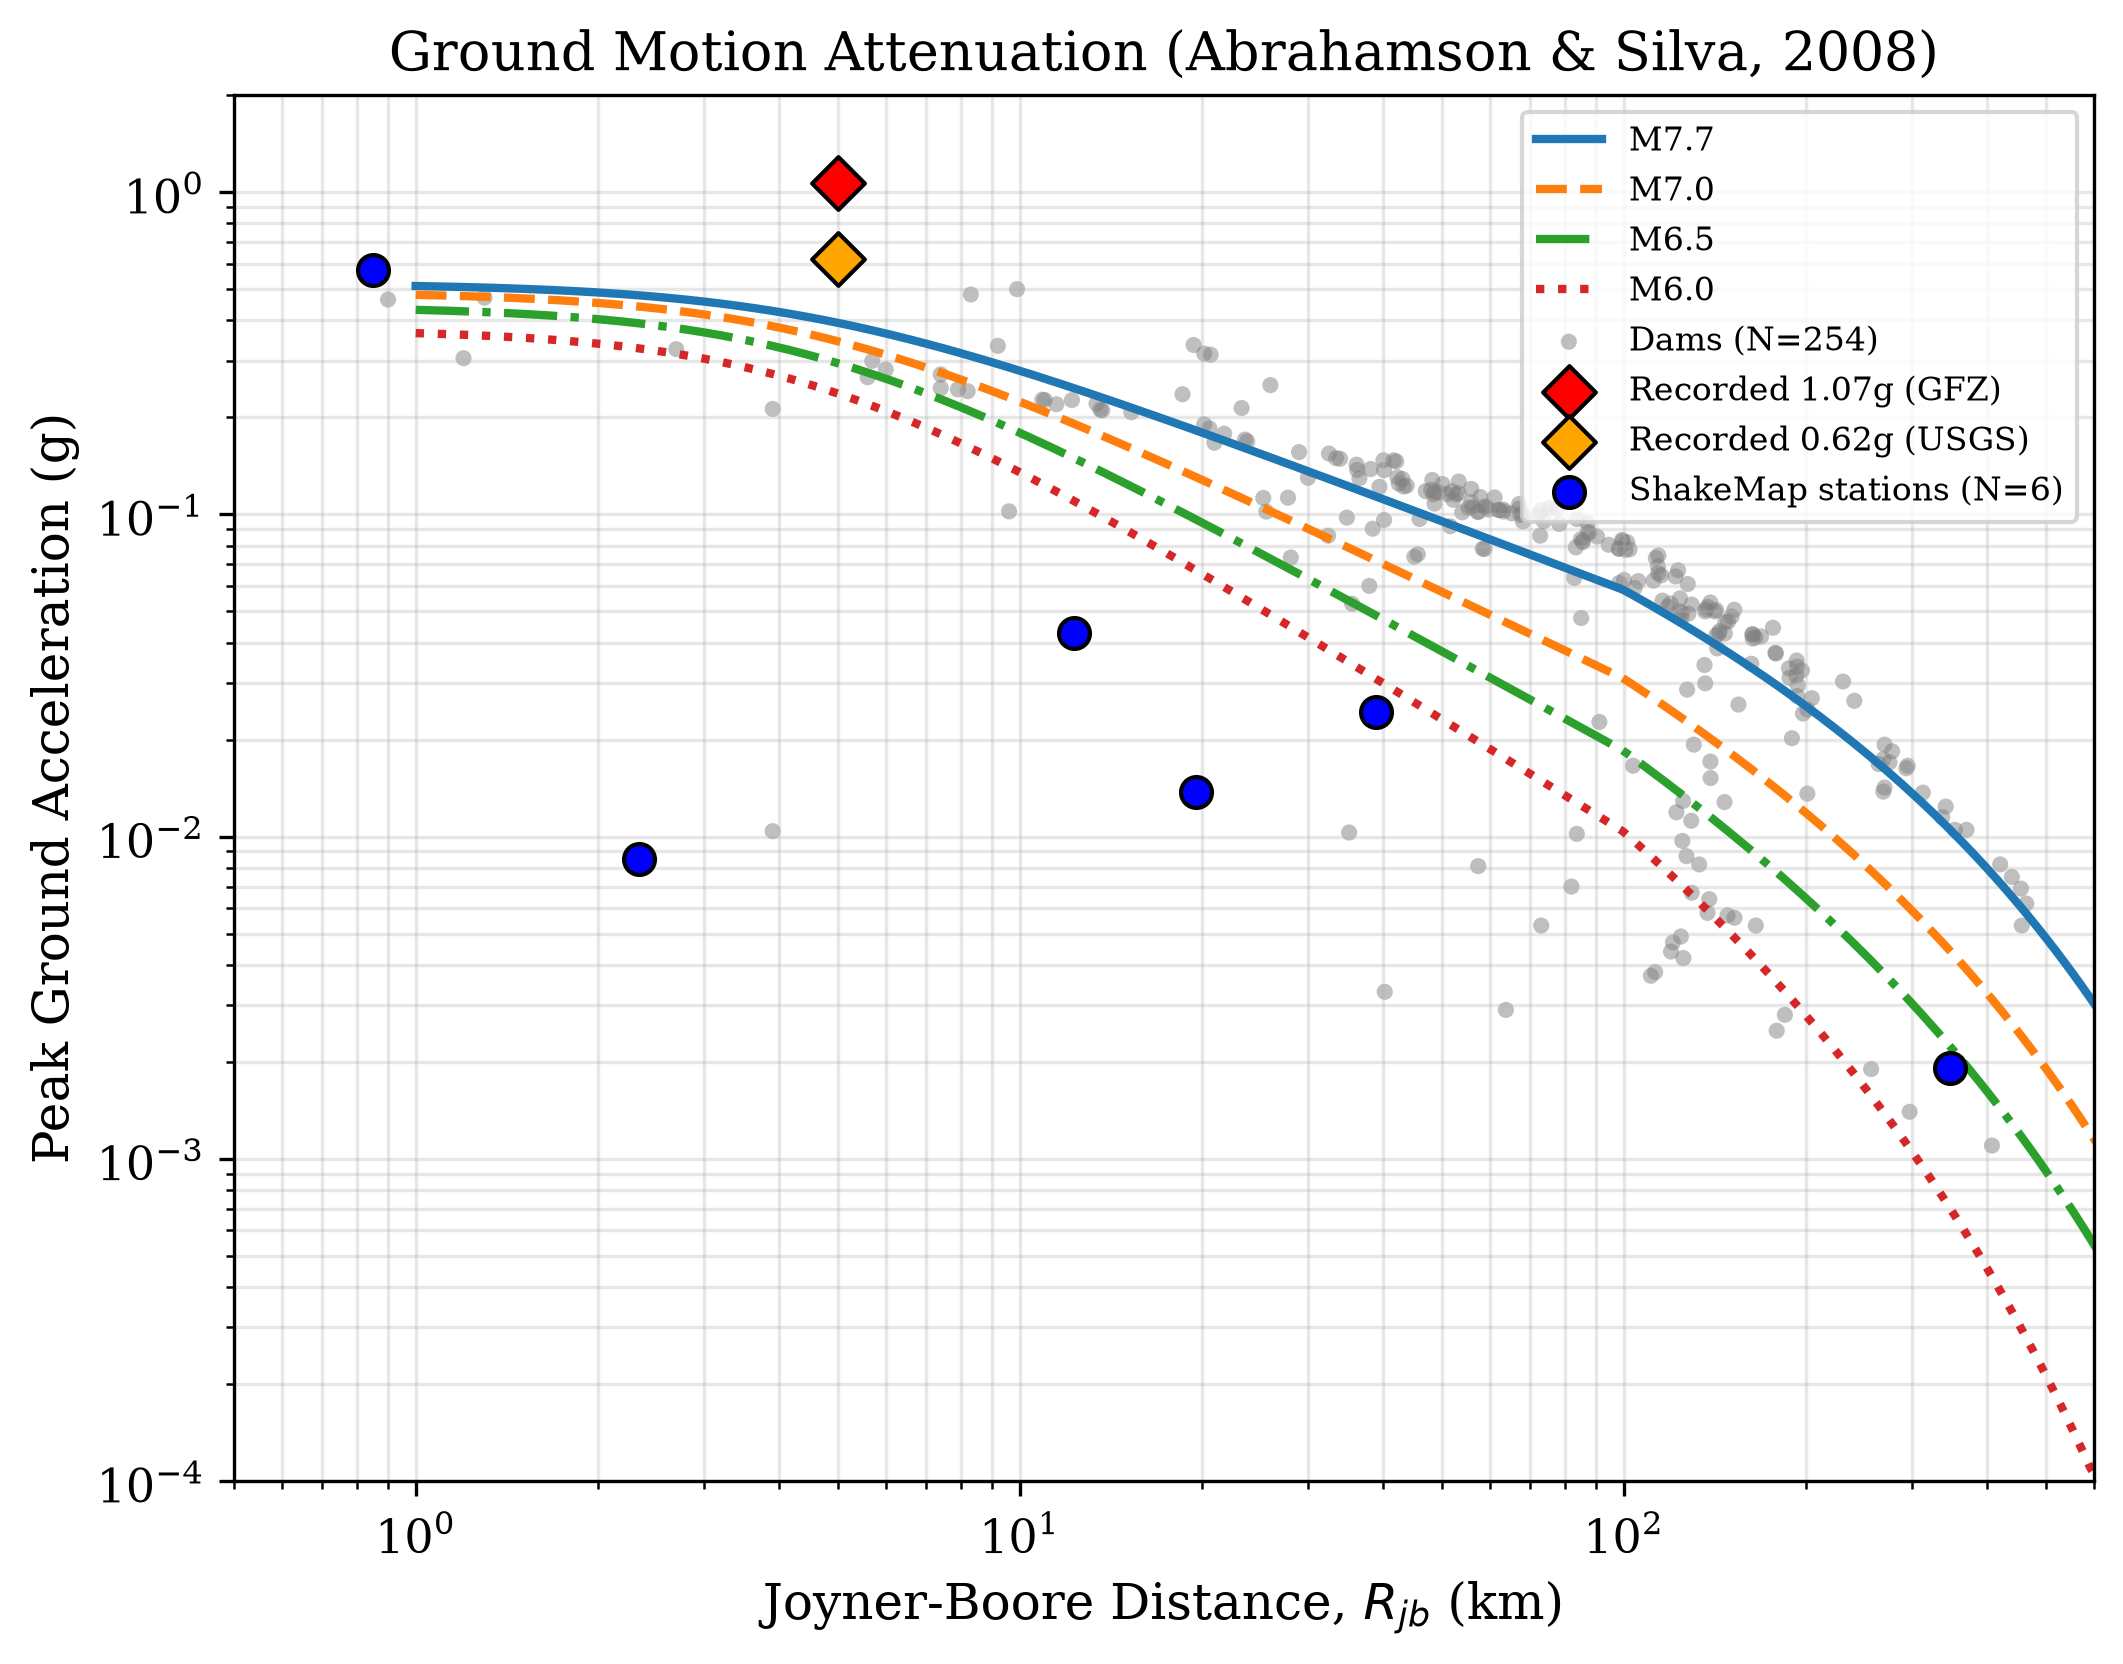
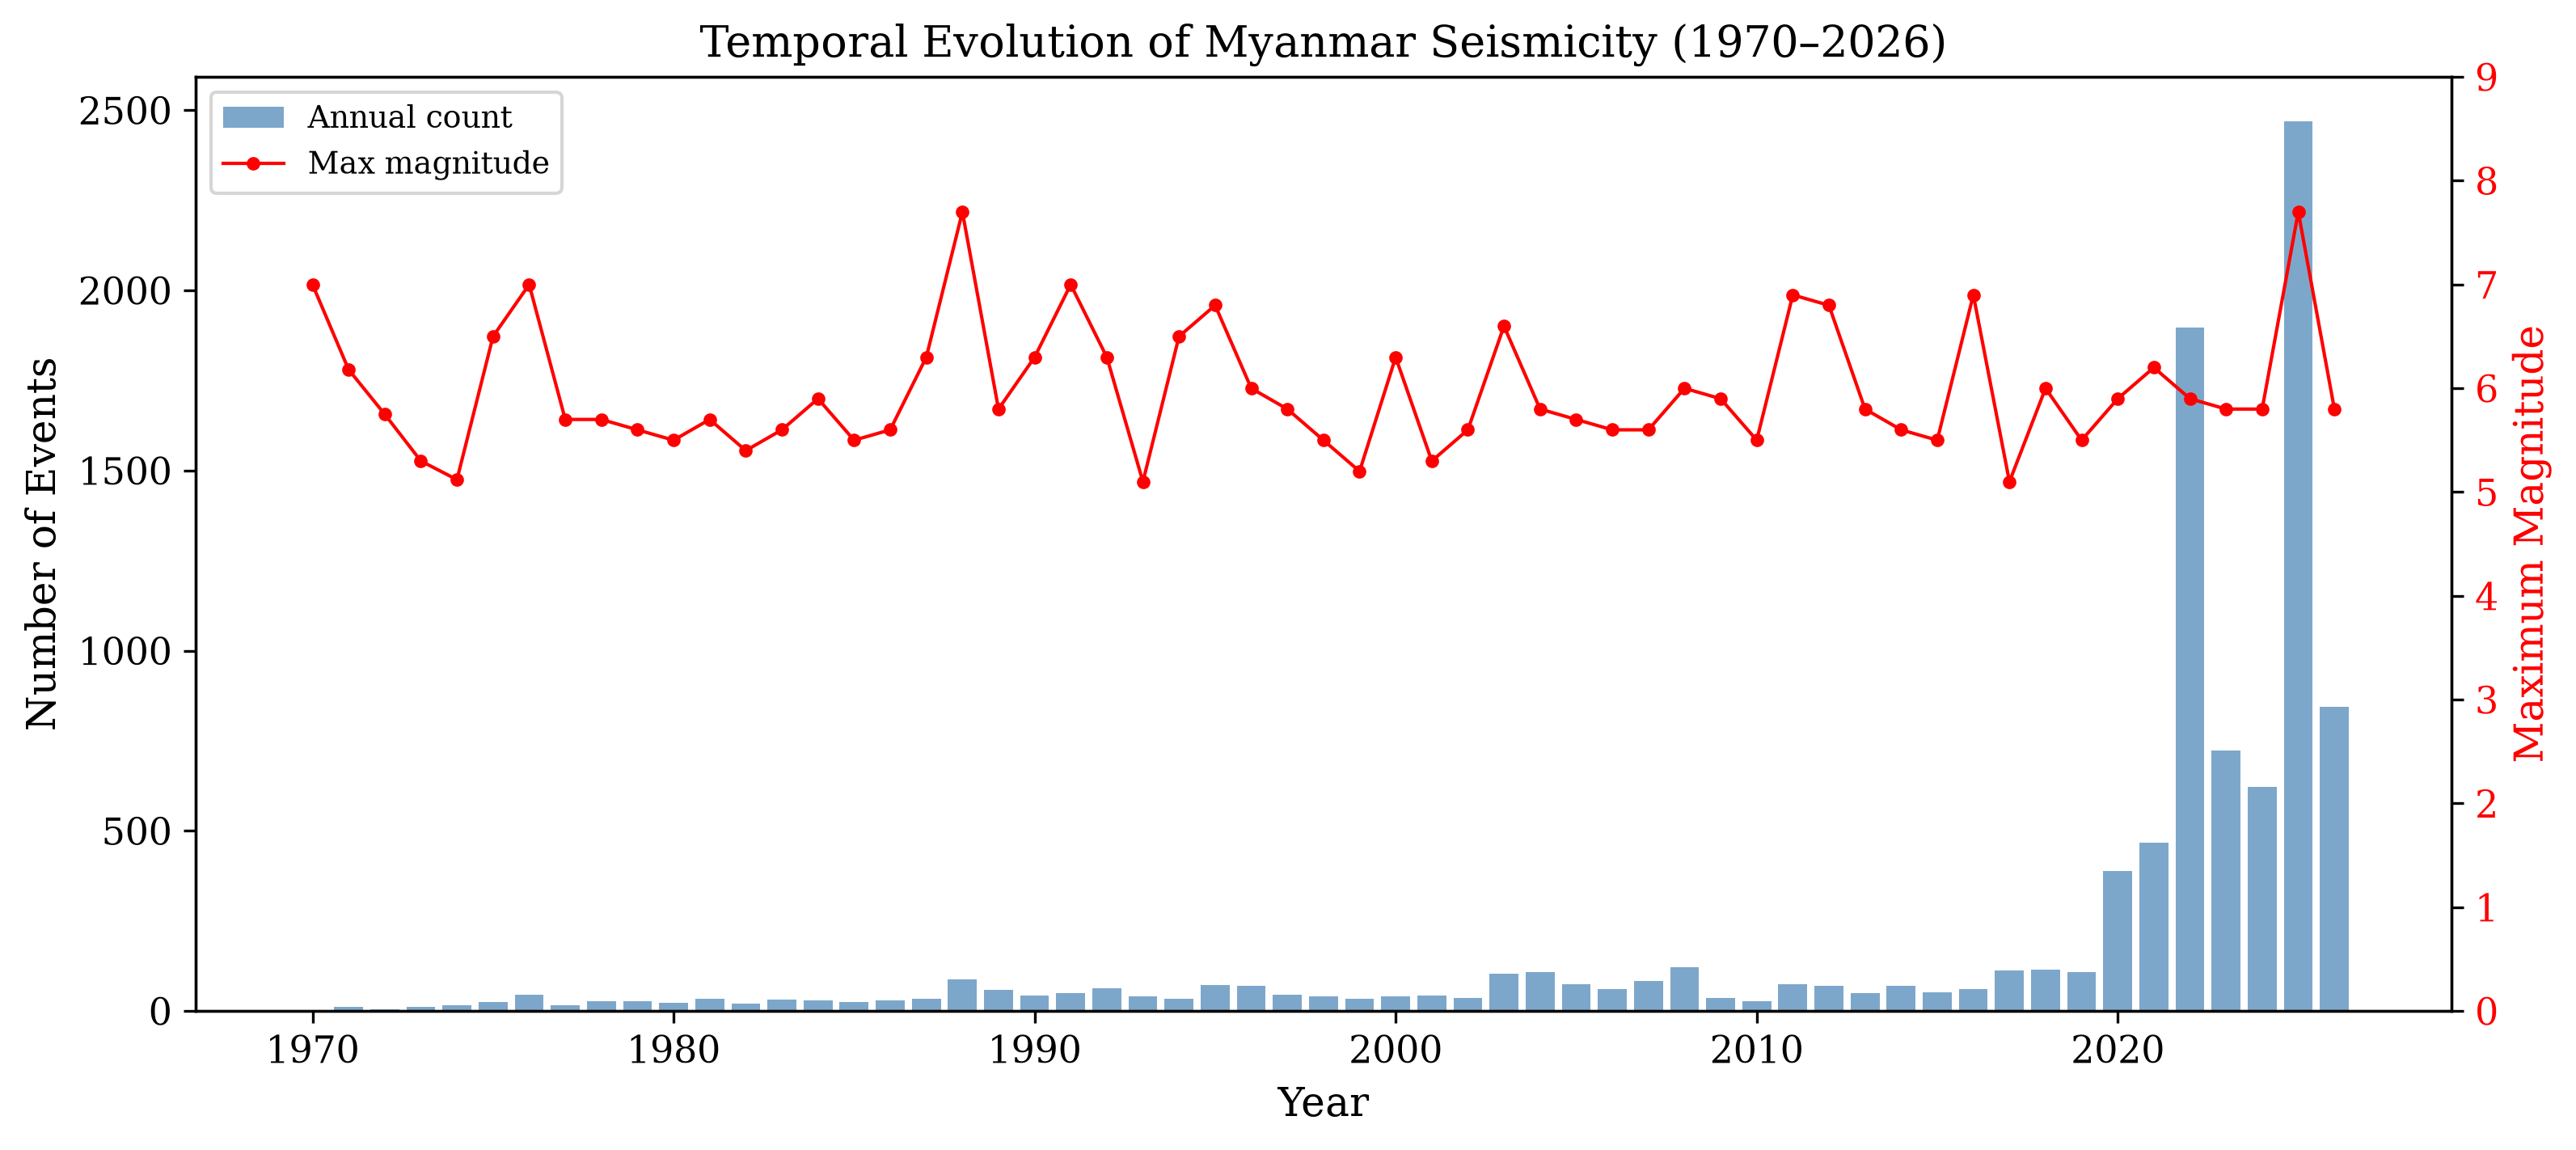
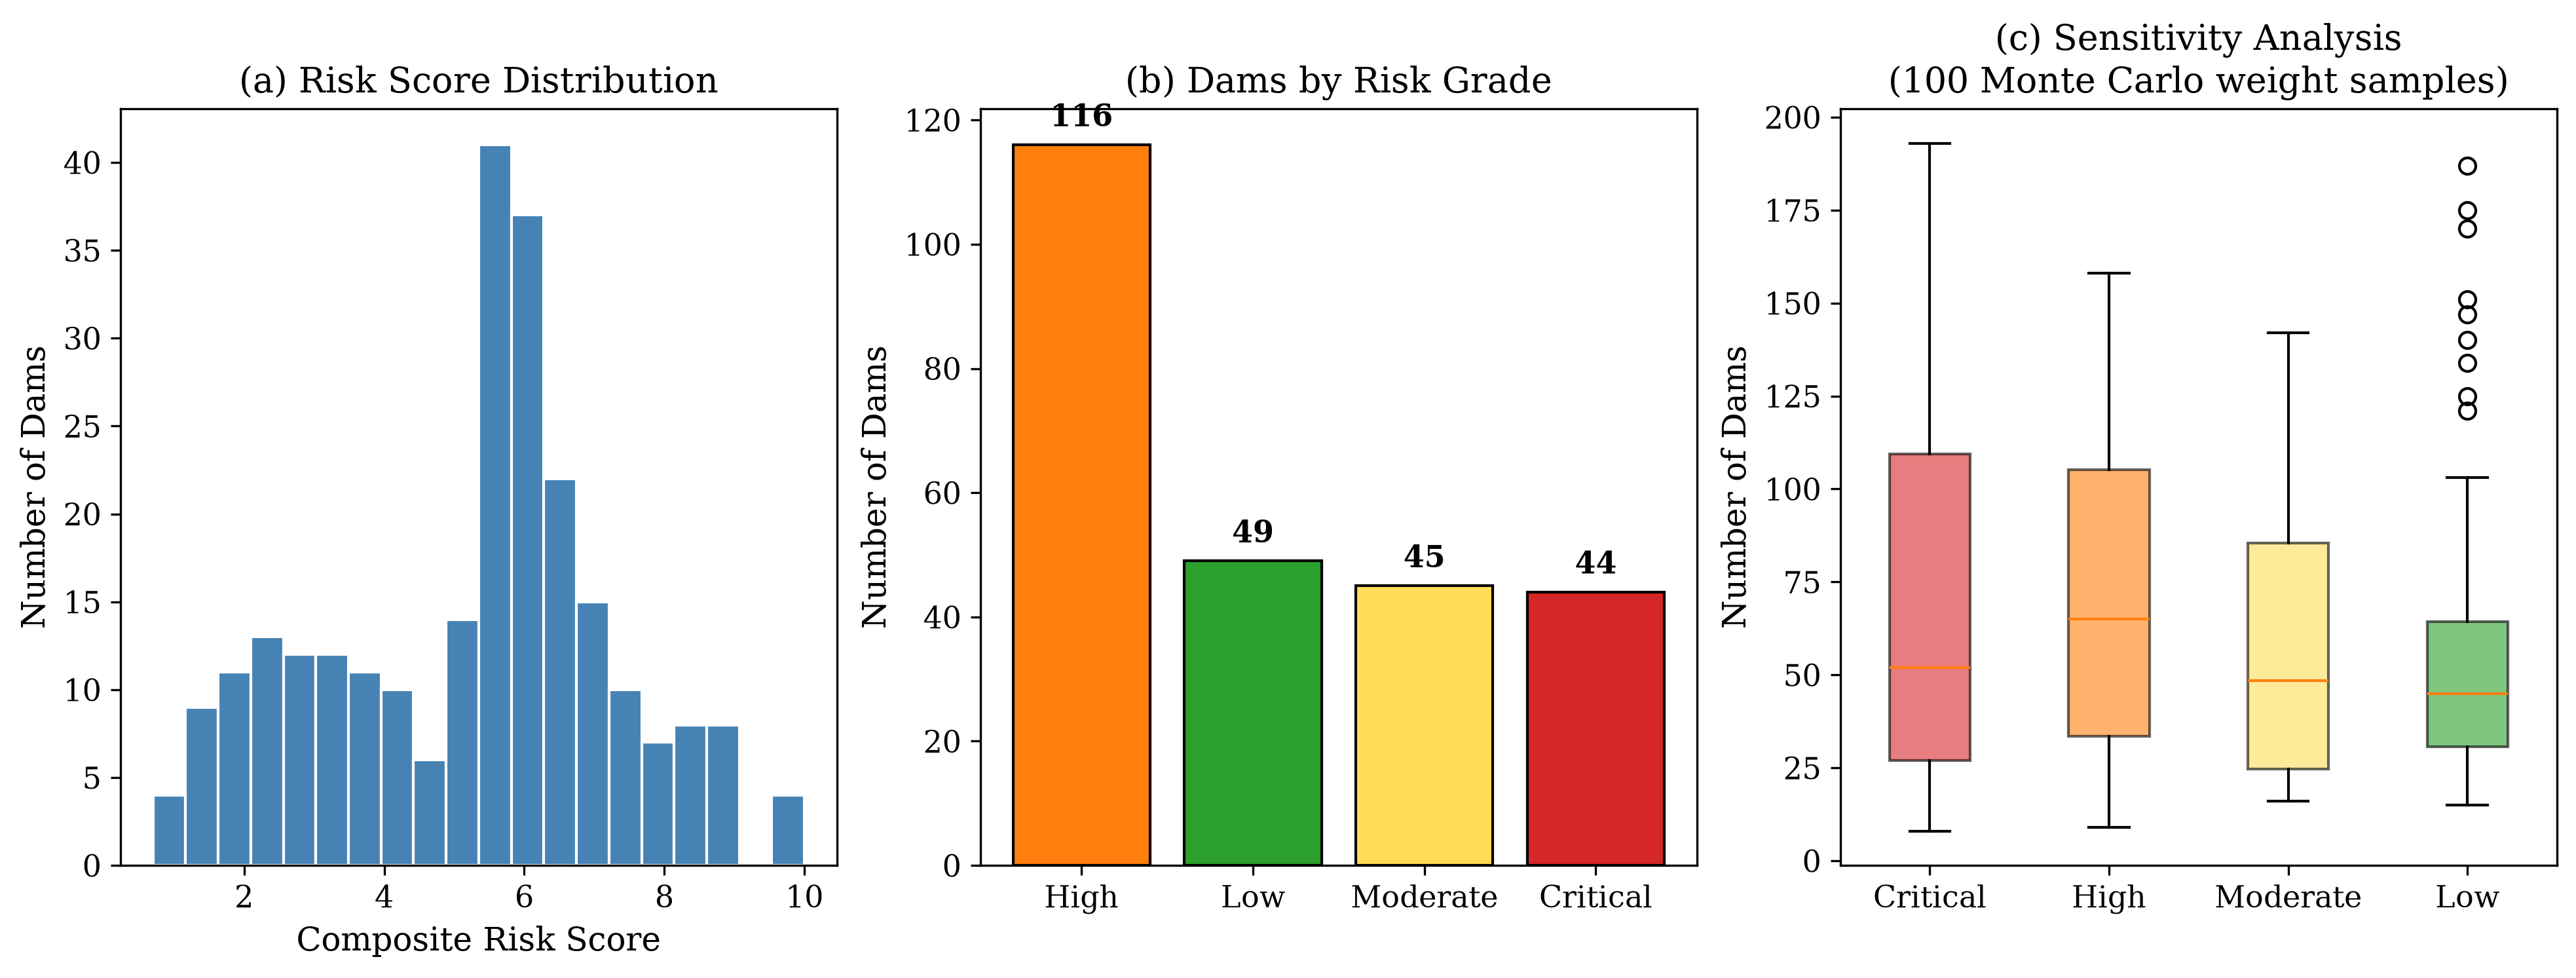
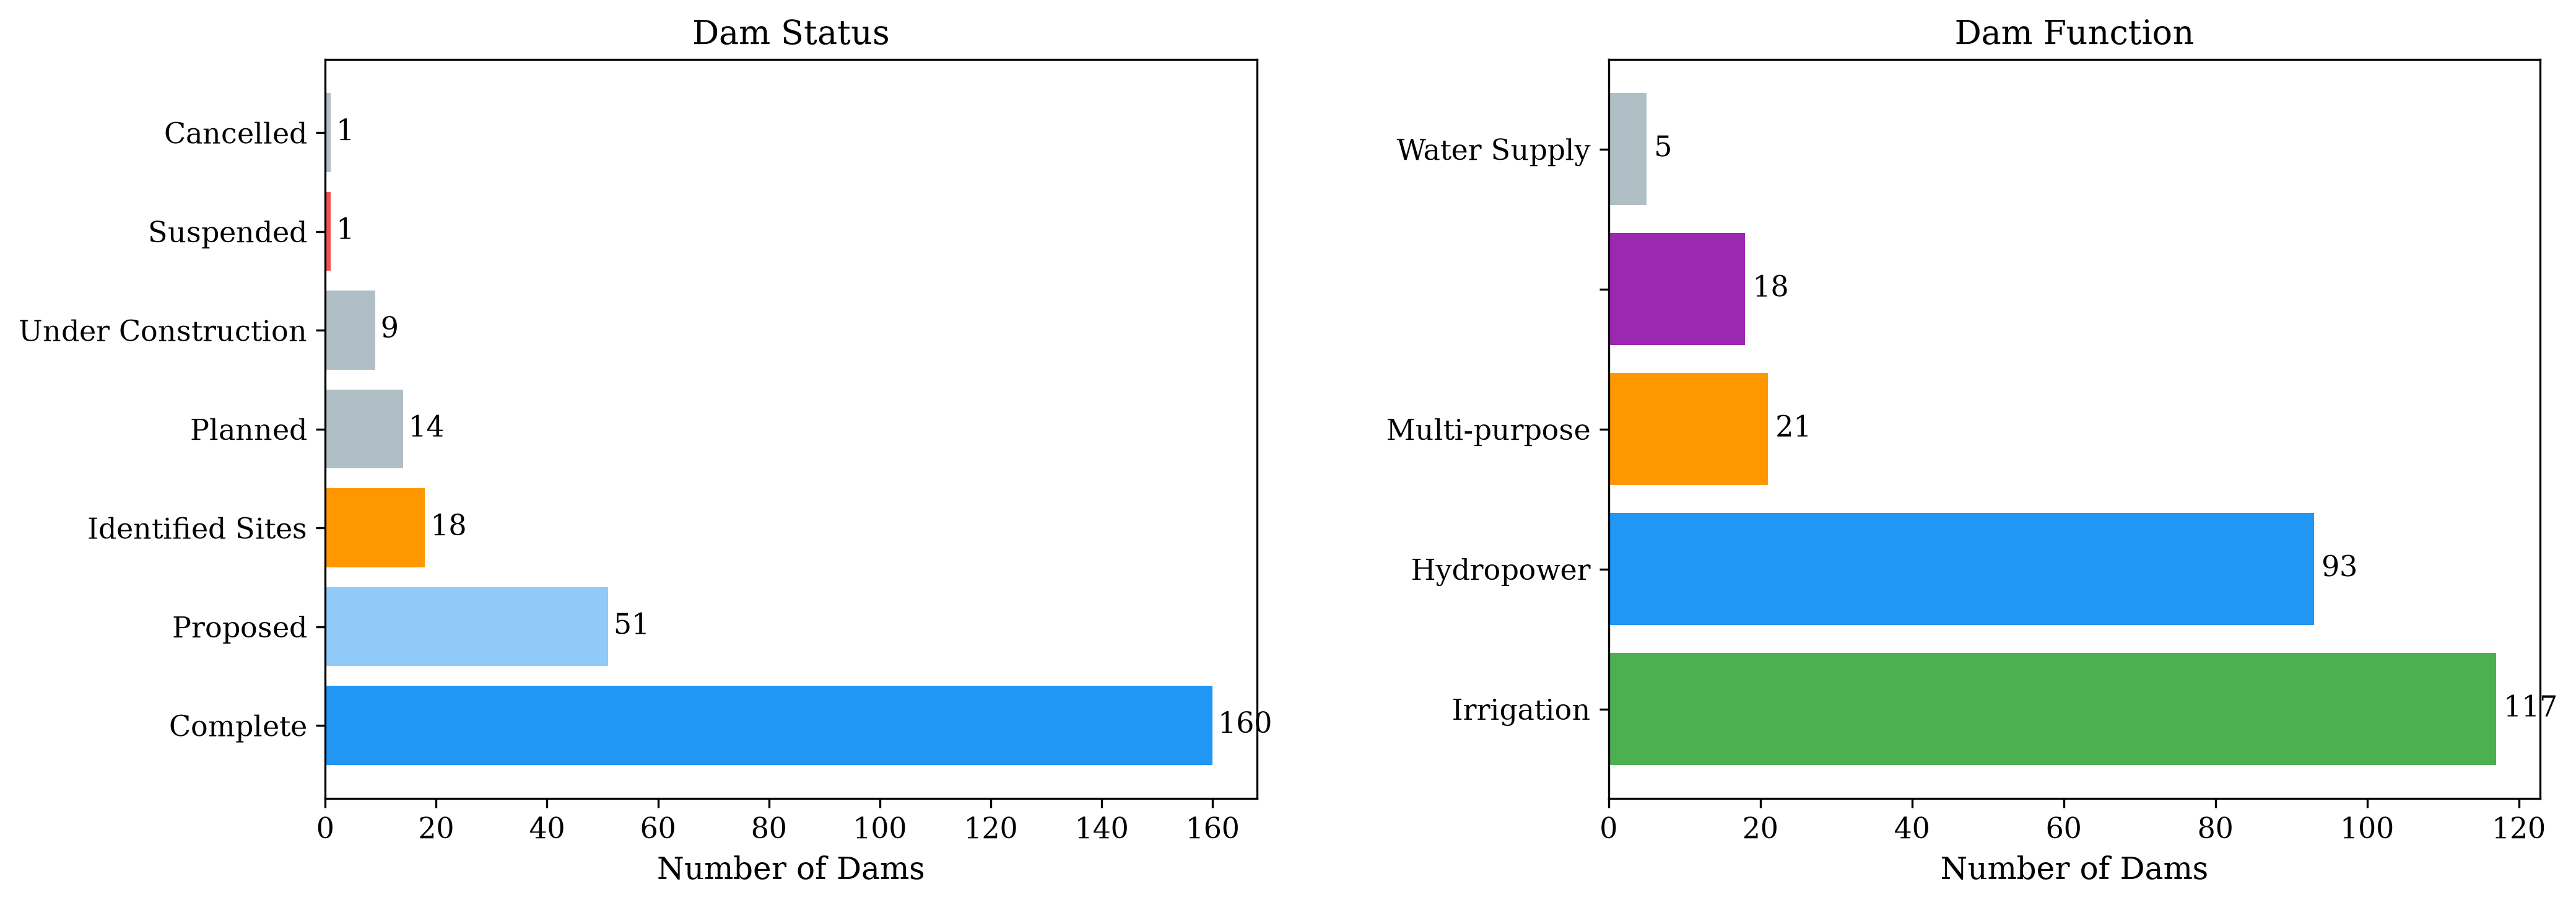
14 figures from the write-up (300 DPI). Click to view full size.